Several weeks ago, I utilized a pivot table to better visualize and organize data for a project. Our group examined the broad effects of the covid-19 pandemic, and I was responsible for analyzing medical information. The World Health Organization has some extremely reliable and relevant information, so I drew my data from here; however, the datasets can quite extensive and difficult to interpret.
As this data contained case and death rates of various countries and territories around the world, I created a pivot table that organized these values based upon a larger group. This larger group is the 6 global regions recognized by the World Health Organization. Therefore, the pivot table collected the data from each country and organized it by sum, based upon its respective global region.
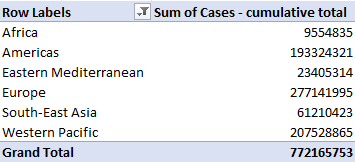
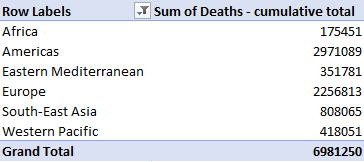
As a result, I often find that pivot tables best suit a large and/or extensive dataset in which several specific values or metrics want to be observed. These tables offer a significantly extensive amount of customization within the particular variable, value, or unit being displayed. An example of this would be column customization to determine dataset groupings sum, count, average, maximum, minimum, or product value.
Sources
World Health Organization. (2021). WHO Coronavirus (COVID-19) Dashboard. Who.int. https://covid19.who.int/data