Pivot tables are a useful data management tool that I have had to learn and use in classes. Pivot tables can help filter through large amounts of data and highlight what you want in an organized table. It is a small step into learning how to create a database and organize mass amounts of data. Below is an example of a basic pivot table and its uses.
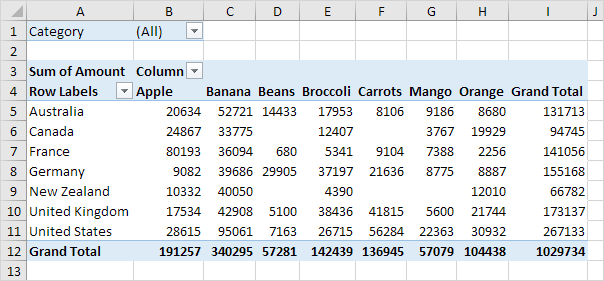
So here we can see a two dimensional table displaying 7 countries and their produce outputs. The drop down arrows next to the word column can change the way the table is organized. You can hide some data as well as shift it from alphabetic order to greatest to least in terms of output production. Hiding data can be useful when you want to display only certain things where any other data may distract from your objective.
Pivot charts can handle a lot of different inputs and a massive amount of data. Pivot tables can be transported across programs. One created in excel can then be shared into a data visualization software like Microsoft Access, Power BI or Tableau. They all take the data from the tables and take their properties and make visuals out of them.