By Ryan Metch
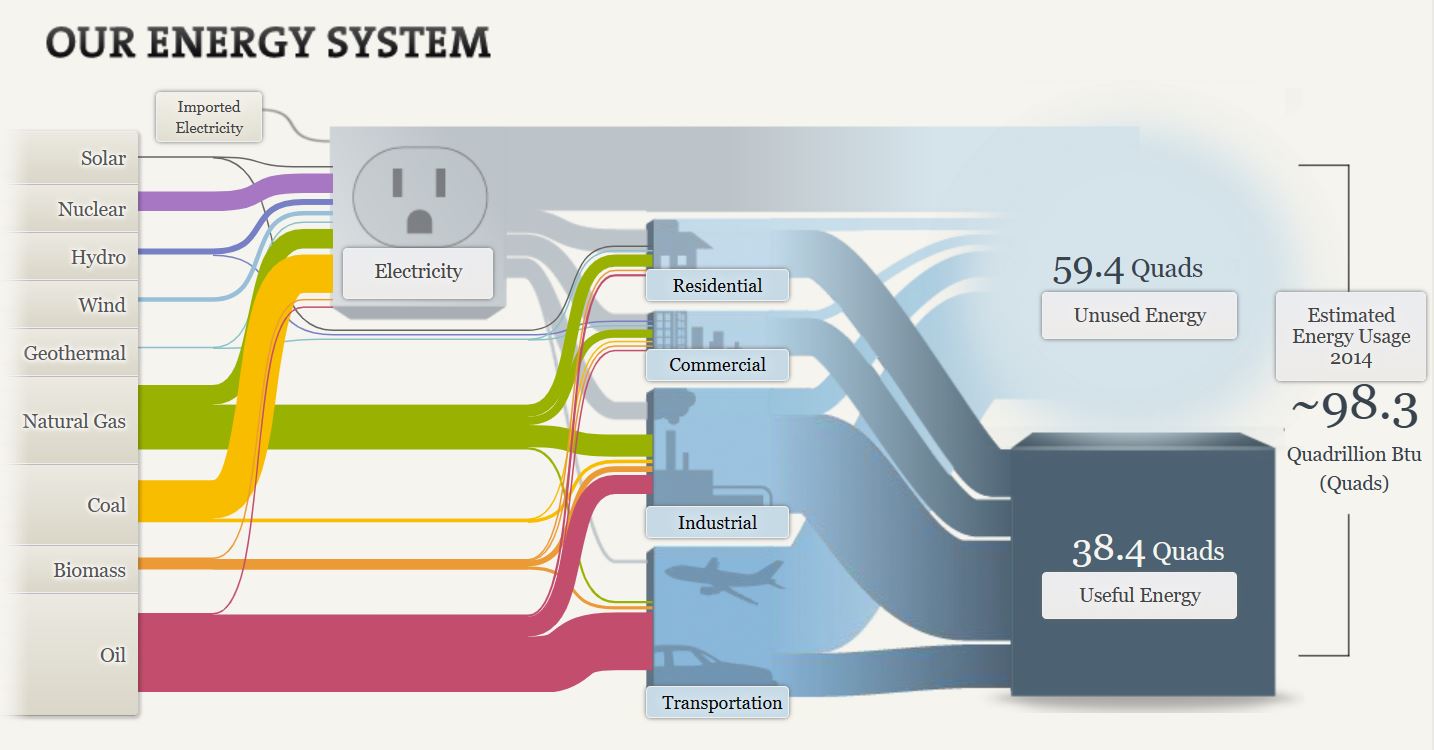
A Sankey visualization is a very unique way to display data. Sankey visualizations are a type of flow chart that can also be interactive, allowing the reader to click on certain areas of the chart to unlock more information on that topic.
In this screenshot I wanted to show just how much information there is in a Sankey visualization, because looks can be deceiving. All of the labels on this chart are actually links to more information on each topic. When you click on them it will further immerse you in that topic, this is something that a lot of charts cannot replicate making Sankey visualizations a very powerful tool.