Overview
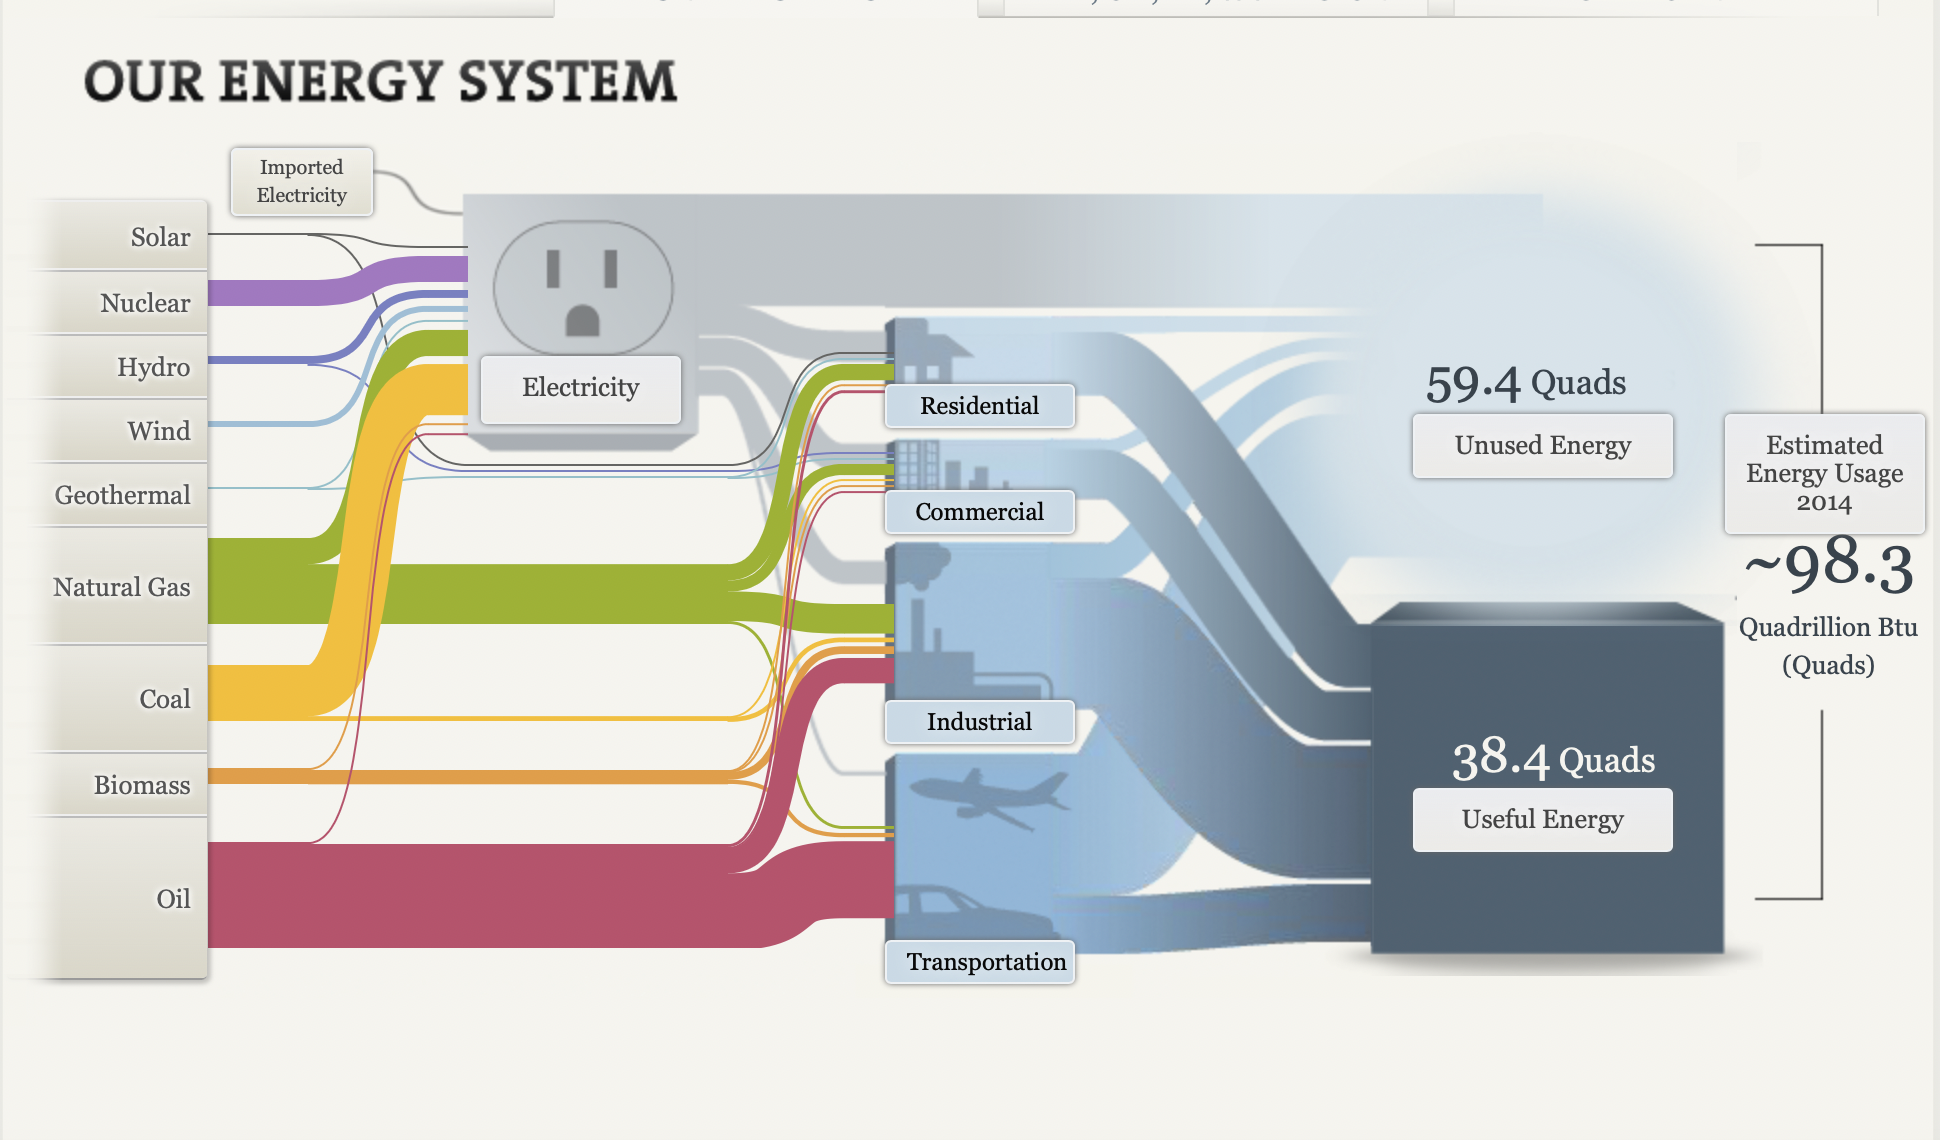
Sankey flowcharts are a type of chart the describes what constitutes a whole, not dissimilar to a pie graph. Sankey however can provide subcategories for the values displayed.
Pitfalls-
With all the minutiae that the Sankey provides to viewers the big picture is in danger of being drowned out. In this example if the goal was to highlight the amount of energy being wasted by the transportation industry for instance, readers might not be able to interpret it without looking for it. Pie charts are definitely a better chart for bringing attention to large discrepancies in parts of a whole.
Interactivity-
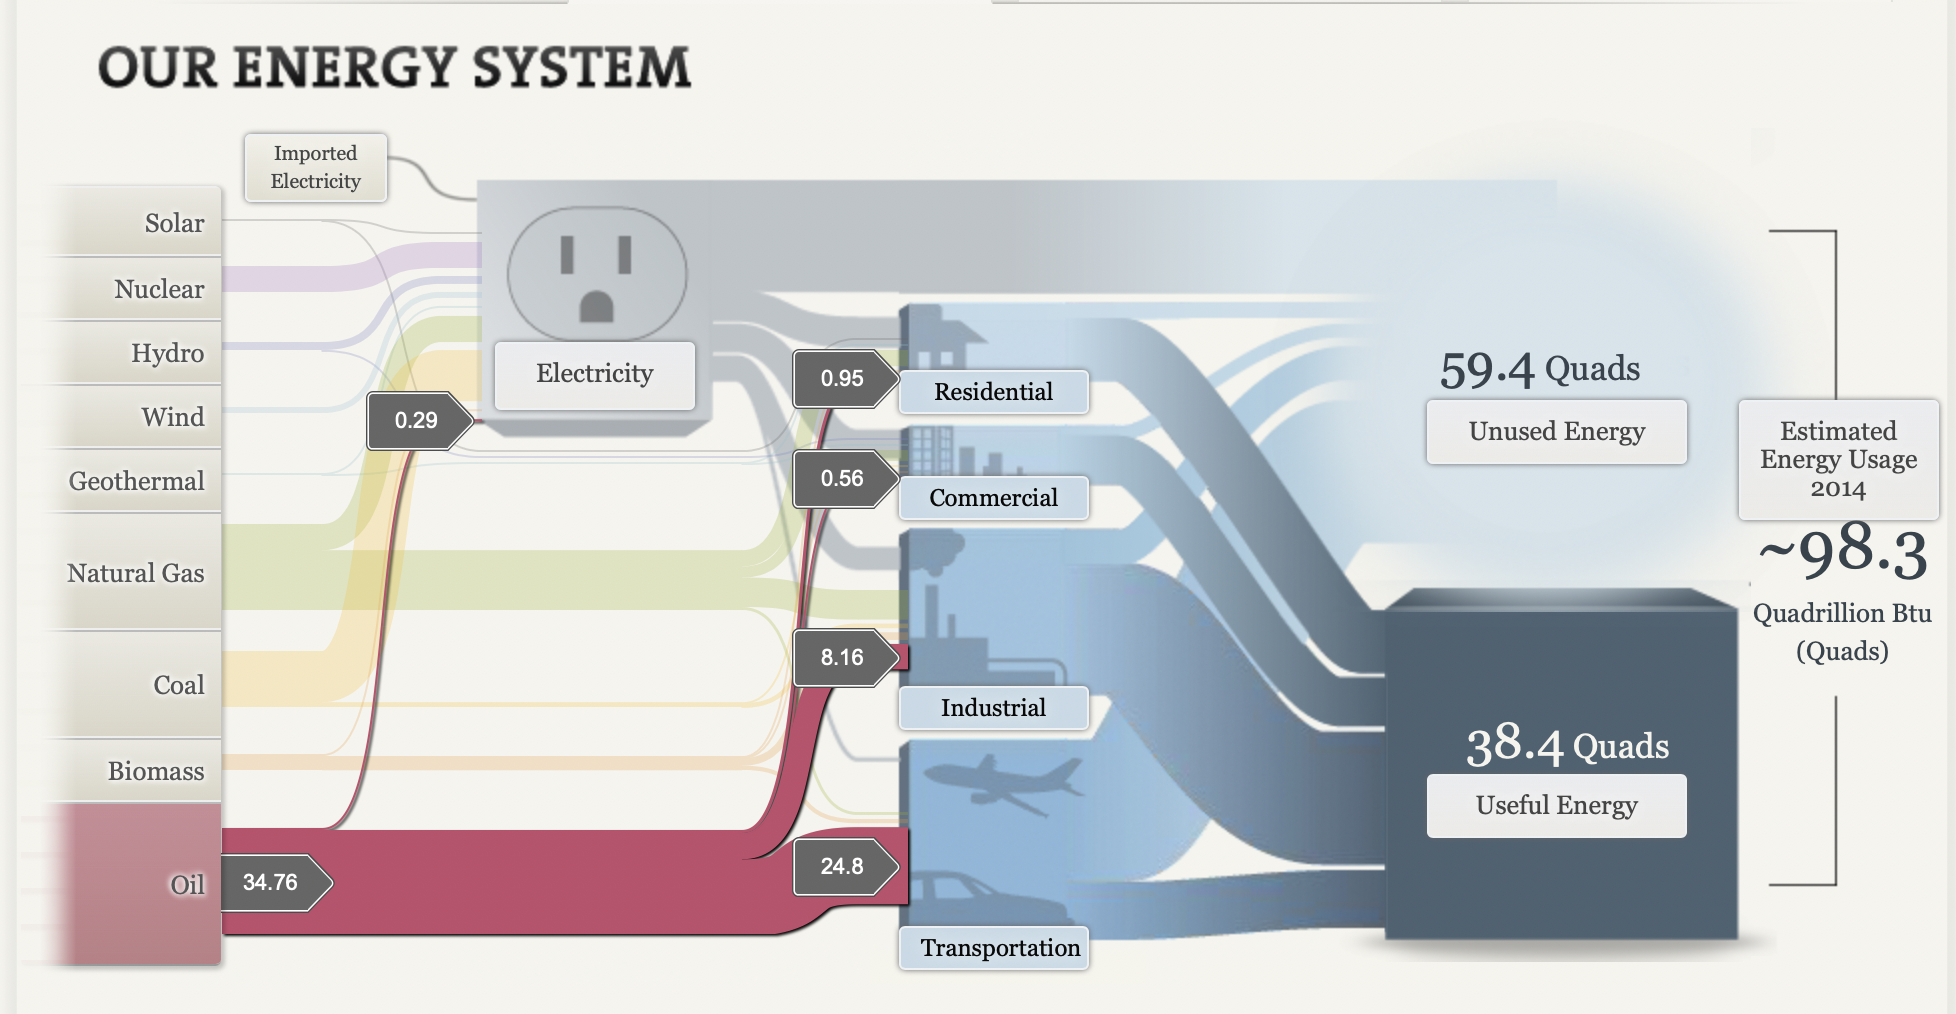
Although some of the finer details present in the data are hard to read at first glance, the dynamic nature of Sankey charts allows dedicated creators to capitalize on this by providing awesome in-depth features like the NAS does here.
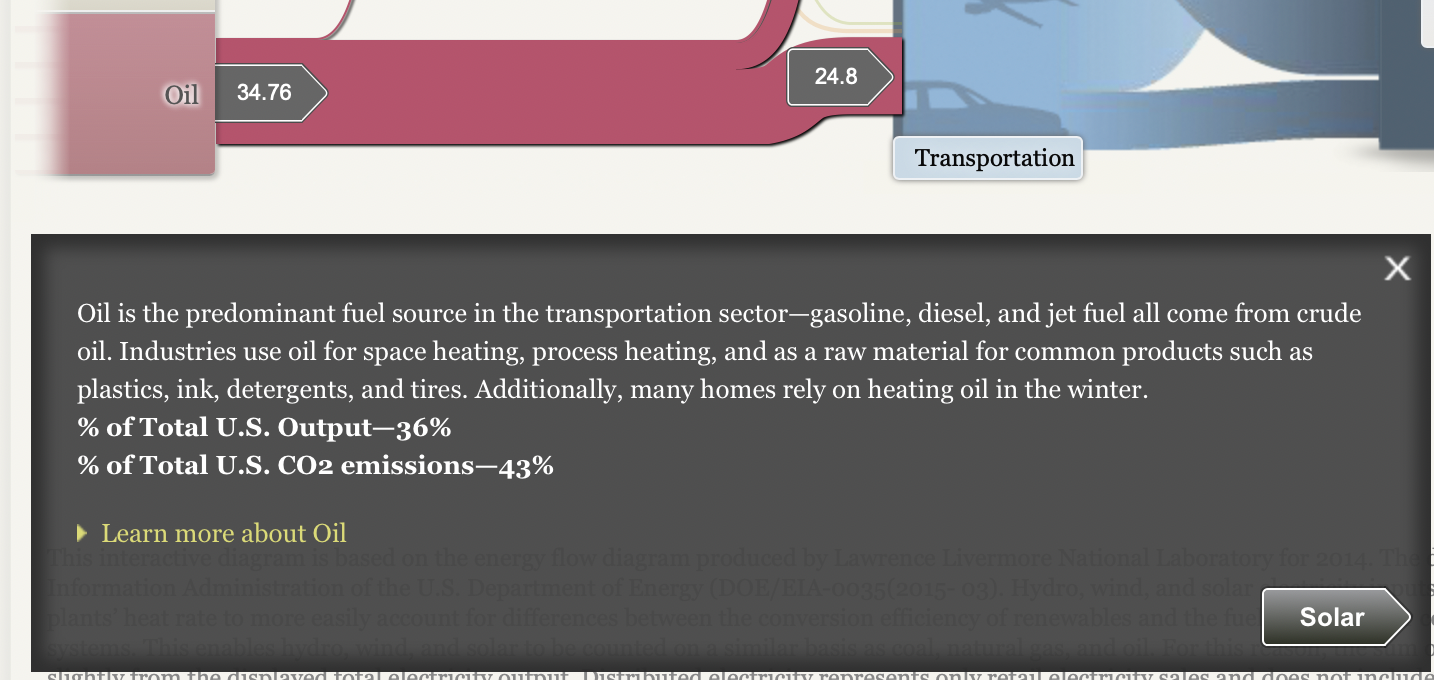
If you know your audience is interested in really digging deep into the data, implementing features like those shown here are a surefire way to make your chart into a showstopper.