This website/article it highlights the intricate nature of the energy system in the United States, which involves a complex web of primary energy sources supplying energy to residential, commercial, industrial, and transportation sectors. Electricity, generated from various sources, distributes energy to these sectors. However, a significant portion of the energy supplied is lost as waste heat or inefficiencies. The United States’ energy consumption is projected to rise, and globally, energy demand is expected to increase substantially in the coming decades.
In how we use energy, it discusses the diverse mix of energy sources, including fossil fuels, nuclear power, and renewables, which contribute to the energy supply. It emphasizes the importance of understanding and visualizing this energy flow. Sankey diagrams can serve as powerful tools to represent this complexity, showcasing the sources and sectors involved, the environmental impact of different sources, and the importance of energy efficiency. Such visualizations can aid in informed decision-making about energy policy, sustainability, and the future of energy production and consumption in the United States and globally.

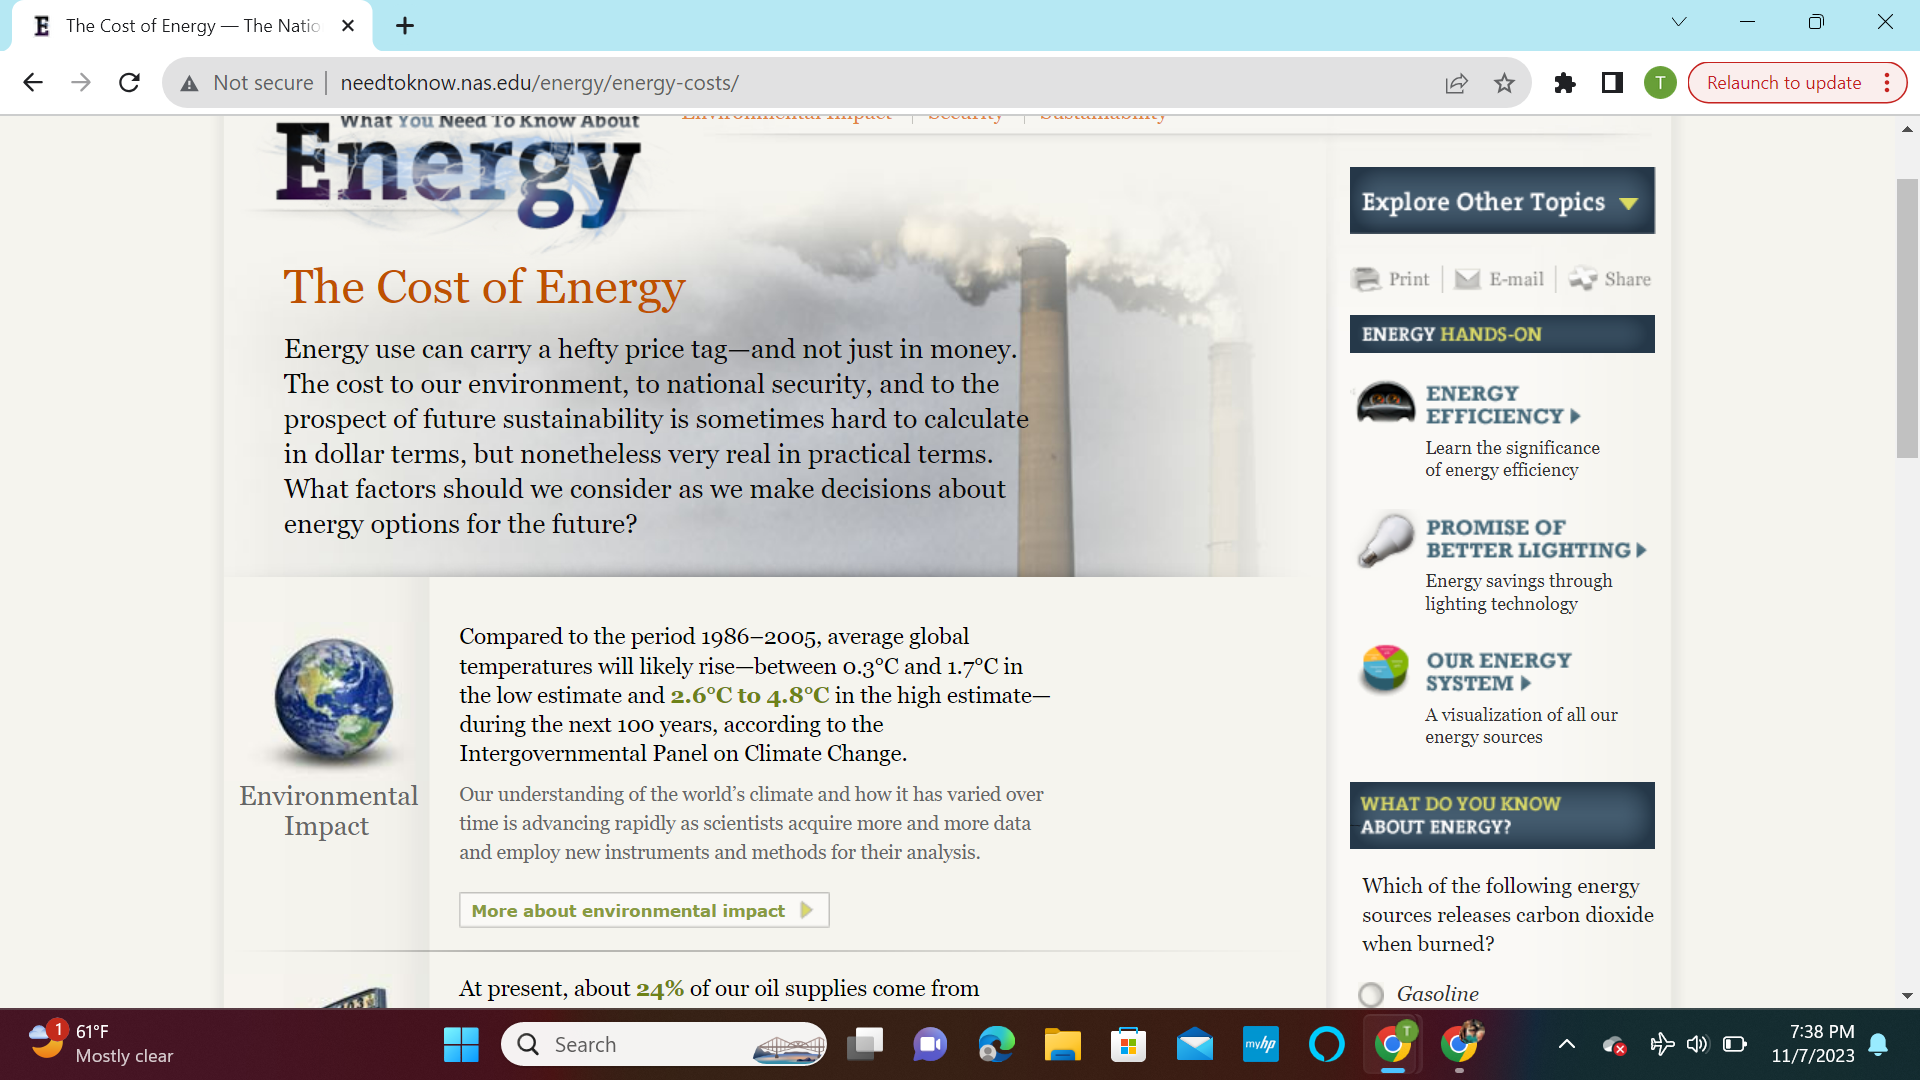
The comprehensive costs associated with energy use, extending beyond monetary expenses. It emphasizes that when making decisions about future energy options, it’s essential to consider environmental impact, national security, and sustainability factors. The text highlights the potential rise in global temperatures due to human-driven greenhouse gas emissions, the need to better understand and address climate change, and the risks associated with an energy supply heavily reliant on foreign sources. Additionally, it raises concerns about the unsustainable consumption of fossil fuels and emphasizes the imperative of accelerating the development and adoption of renewable energy sources for a more sustainable and secure energy future. In essence, it calls for a holistic and forward-thinking approach to energy decision-making that takes into account these critical factors.

All of the graphs were fun to play around with, but easily confusable. In the graphs, I liked how you could click individual parts and let you understand a little bit more about how it works. All in all I liked how the article came out.