Today we will be deep diving into how different people show comparisons to the benchmark. A benchmark is a standard or point of reference in which things can be compare. A great example is when benchmark testing was taken place during schooling. This data was used to see where you compare against students the same age as you.
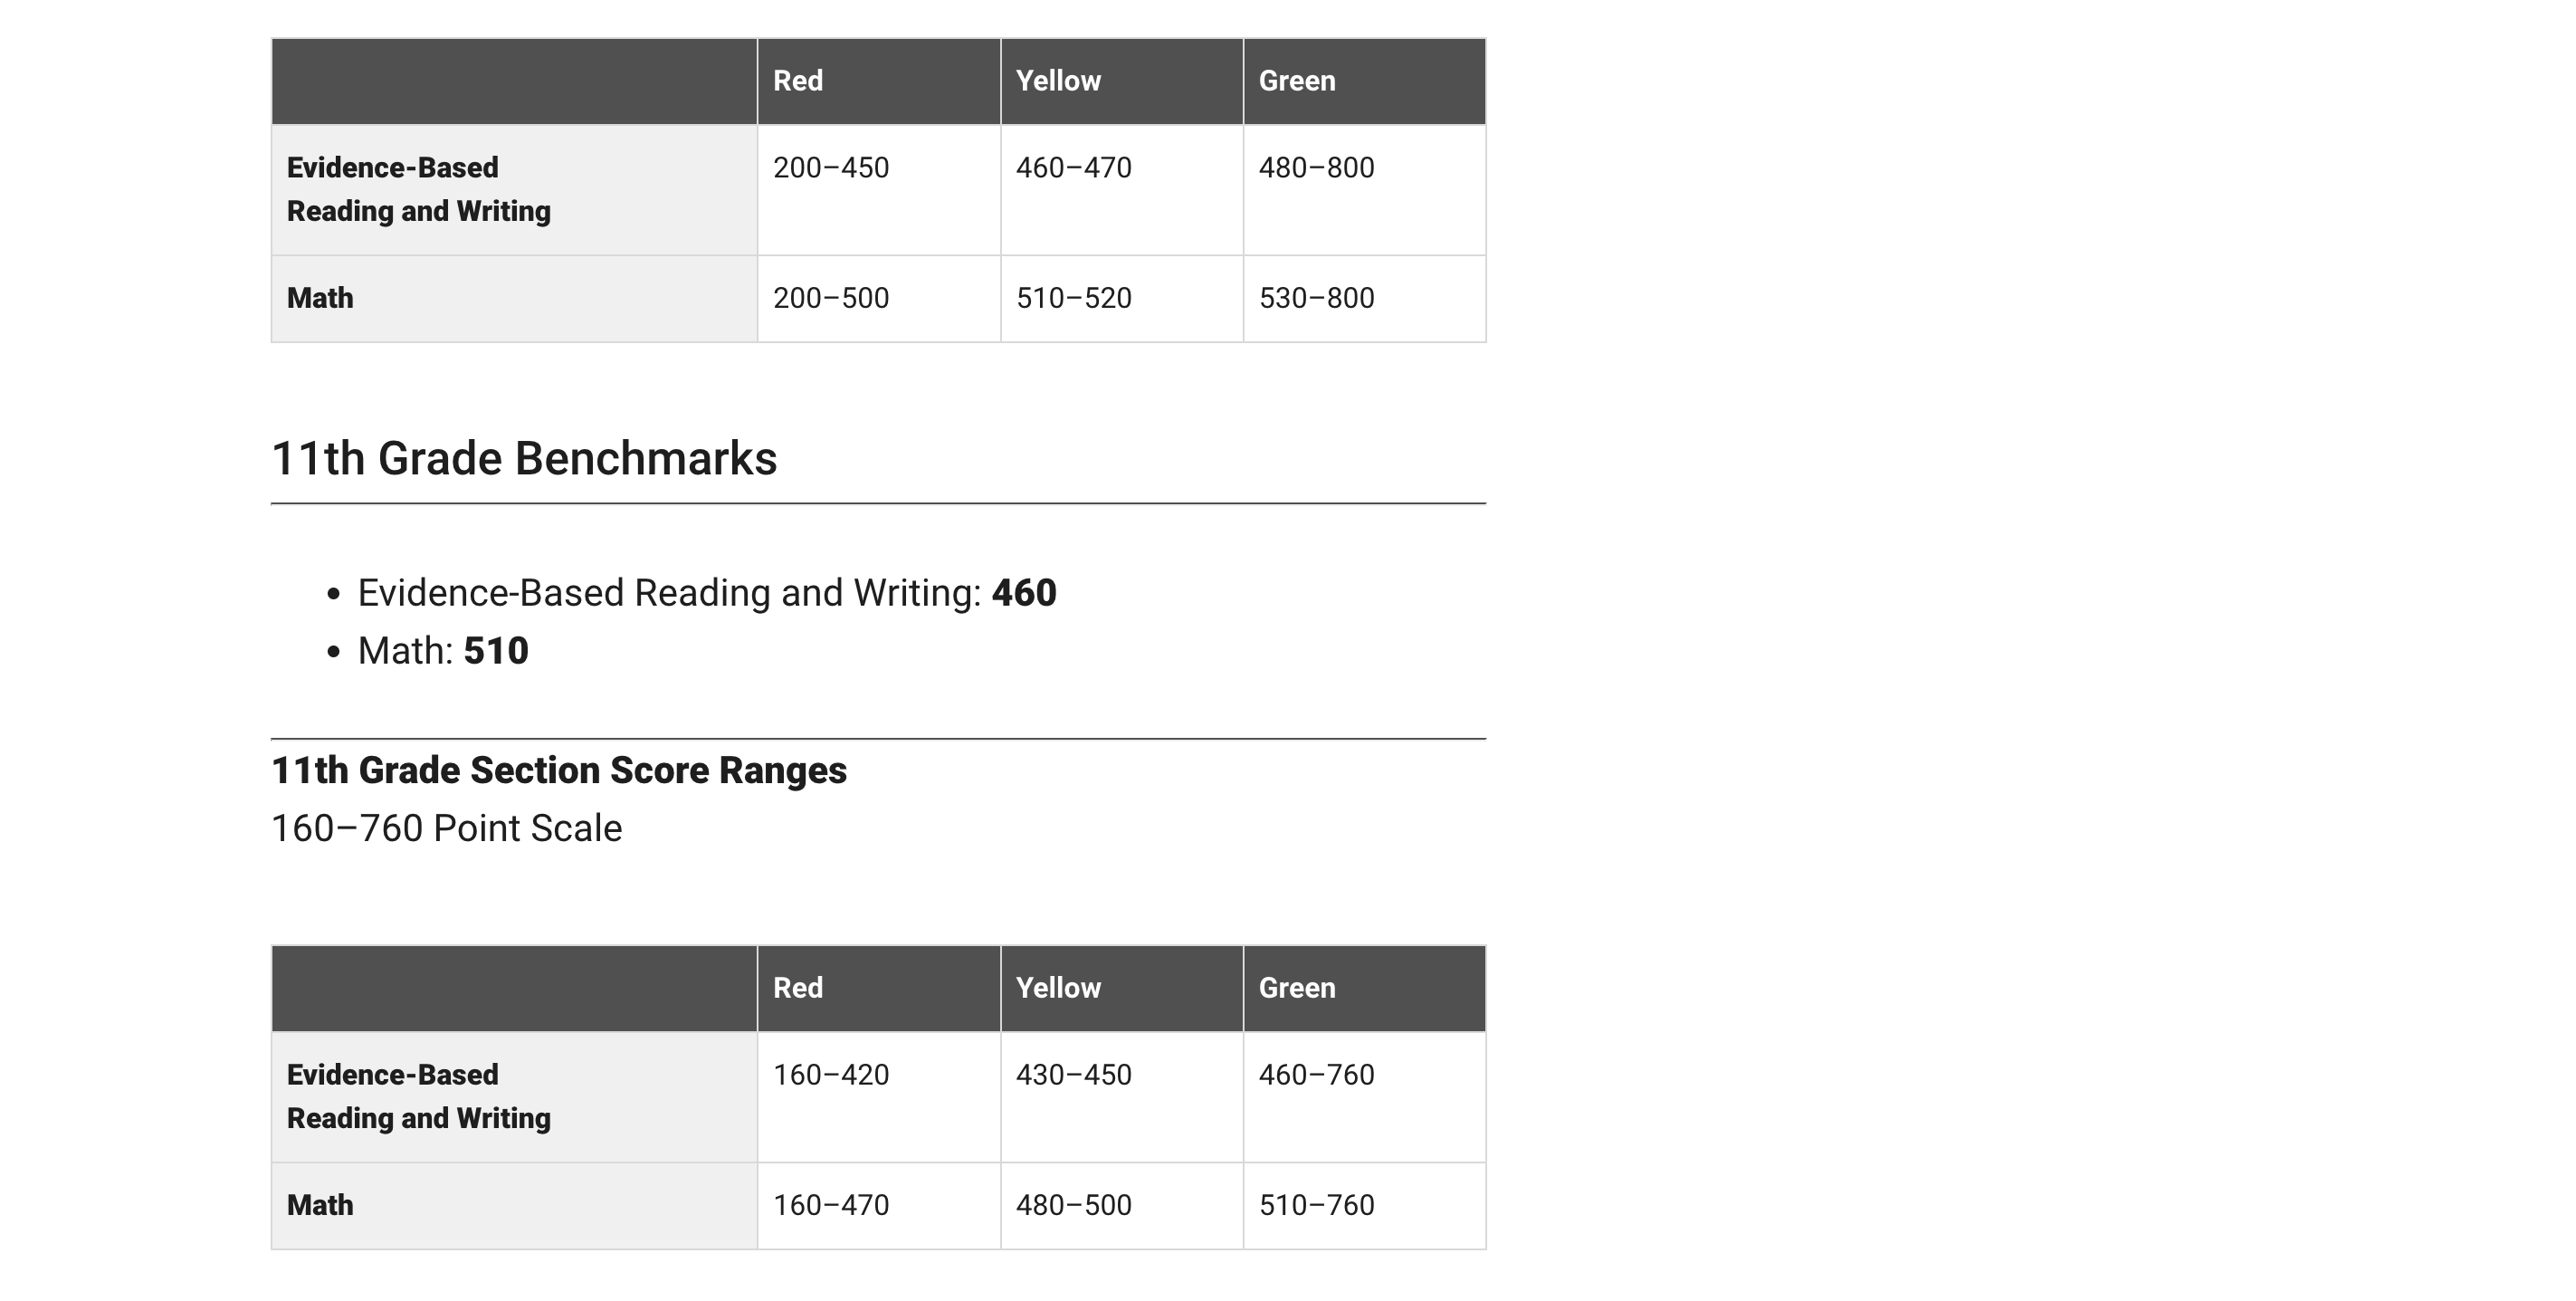
I will be using the college board SAT testing as an example. The college board uses benchmarking in order to determine where your test score should land based on your grade level. In the example below, they state that the benchmark is 430 for reading and 480 for math. These scores are based on if you were a 10th grader. They then breakdown the score into three categories: Red, Yellow, and Green. These sections represent how below or how above you are the benchmark.
In the article, How Perceptions Can Skew Reality: A Data Visualization Approach How NYC schools’ academic performance differs from public perception, they use benchmarking to determine where each borough of NYC lands with regards to SAT testing. In this article they take into consideration things such as poverty level.
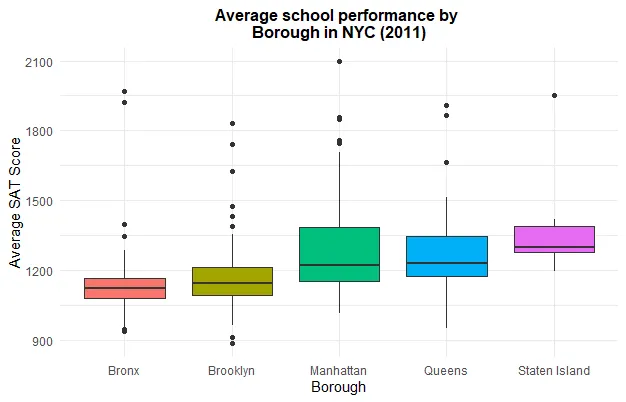
Schools in the Bronx performed worse due to the fact that the poverty rate is much higher. I feel as if data visualizations are very important especially with regards to benchmarking. It allows for an individual to compare themselves to the norm and make adjustments where needed. Everyone has grown up with benchmarking especially with regards to academic performance on things such as standardized testing. its interesting to put this into perspective.