By using infographic tools, benchmark analyses are presented in a variety of visual formats. In accordance with the Robert Wood Johnson Foundation’s considerations for selecting a benchmark for health equity. In other words, benchmarking can be used to evaluate health gaps and assess the quality of care to address these disparities. There are advantages and disadvantages when using different approaches to benchmarking health equity. It was concluded that there was no bet method for selecting a benchmark for health equity assessment.
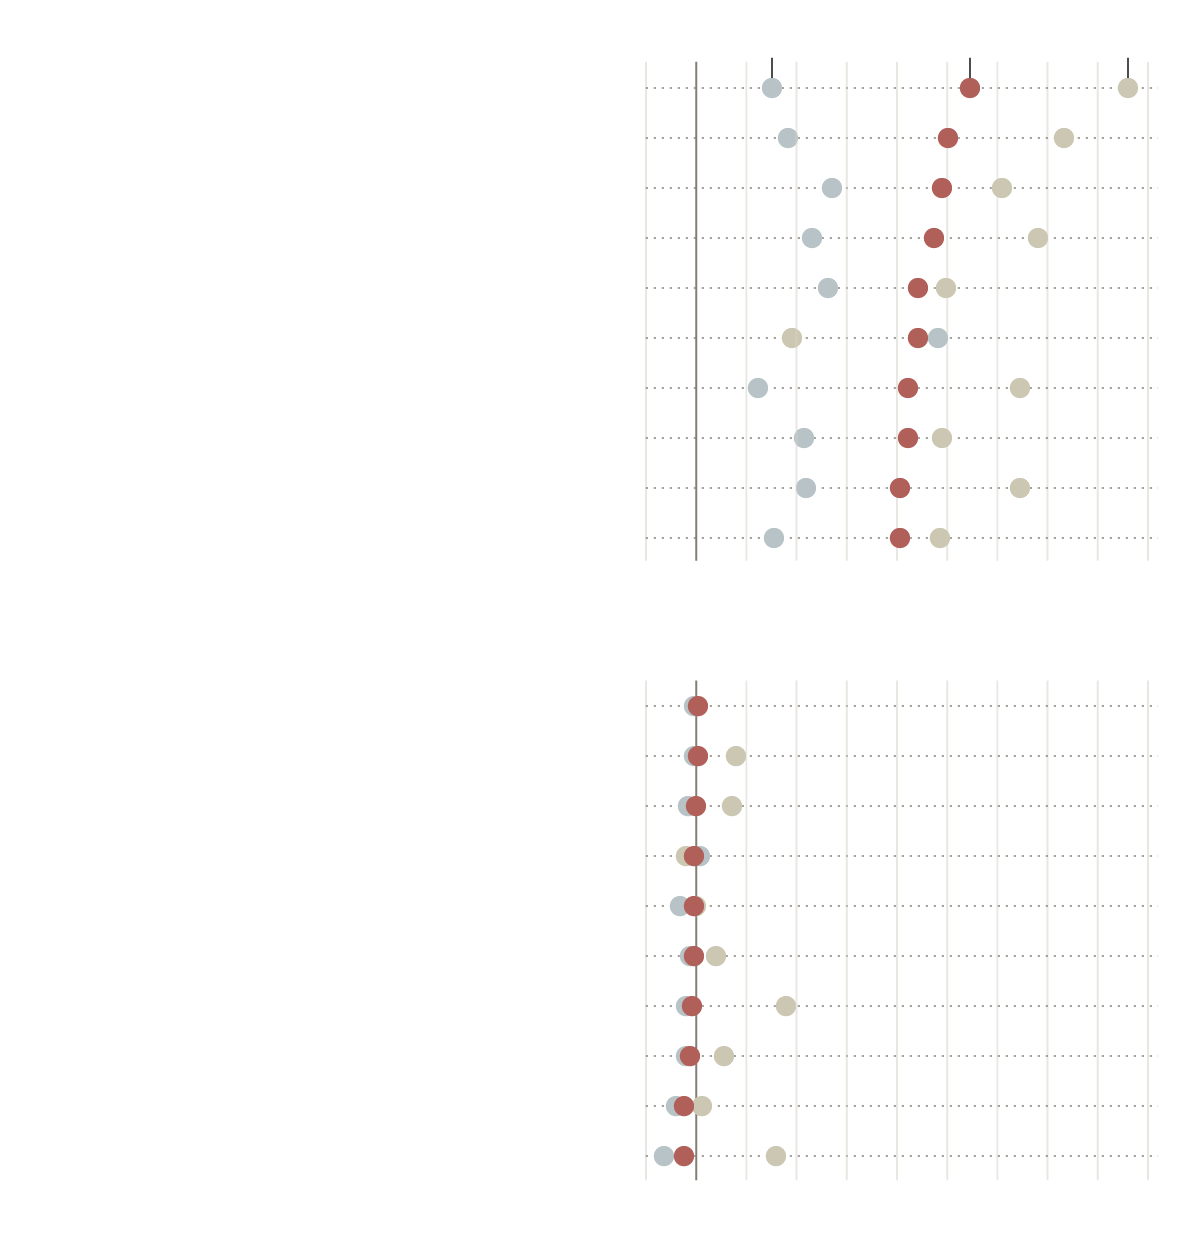
Examining the results of the RAND study reveals how much hospitals are charging private insurers. Two scatter plots are used in New York Times article, to illustrate the most and least expensive hospitals for private insurers, compared to Medicare. In the first scatter plot, the most expensive hospitals are displayed, while in the second plot, the least expensive hospitals are displayed. Among the benchmarks was Michigan, where private sectors are about two and a half times those charged my Medicare. Further details about how prices vary greatly
This is powerful distinction that RAND made to conclude that market forces are not working. This is always important to know and understand, since this involves financial income and it’s everyone’s right to know when they have been taken advantage of. The ability to see these data numerics visually makes all the difference.
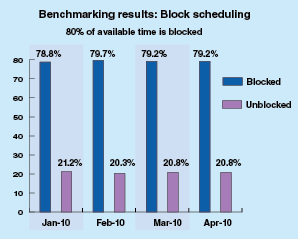
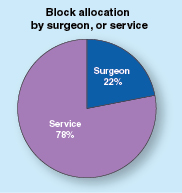
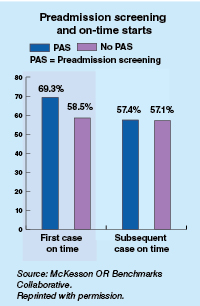
As another example of an infographic benchmark, the ormanager analyst offers benchmarks based on actual data from the sample of hospitals displayed. Comparisons are between two bar and 1 pie charts. As a result these correlations, they can differentiate between hospital productivity, hospital factors, like country (US or Canada), building type, and number of operating rooms. It was found that on average, US hospitals had lower scheduling quality than their Canadian counterparts. The turnaround time for US facilities was 15 minutes longer than expected compared to Canadian facilities.
Final Thoughts
As a result of my research, I have gained a in-depth understanding of infographic benchmark and the many domains and employment that they can be applied to in order to assist with the comparison of analytical data displayed in graphs. These tools have further piqued my interest and I would like to see more visual infographic comparisons in my own research fields and use them to make distinctions and not differences in future research papers.