http://www.vizhealth.org is a informational website developed by the University of Michigan, dedicated to providing resources for creating better data visualizations in healthcare and medicine.
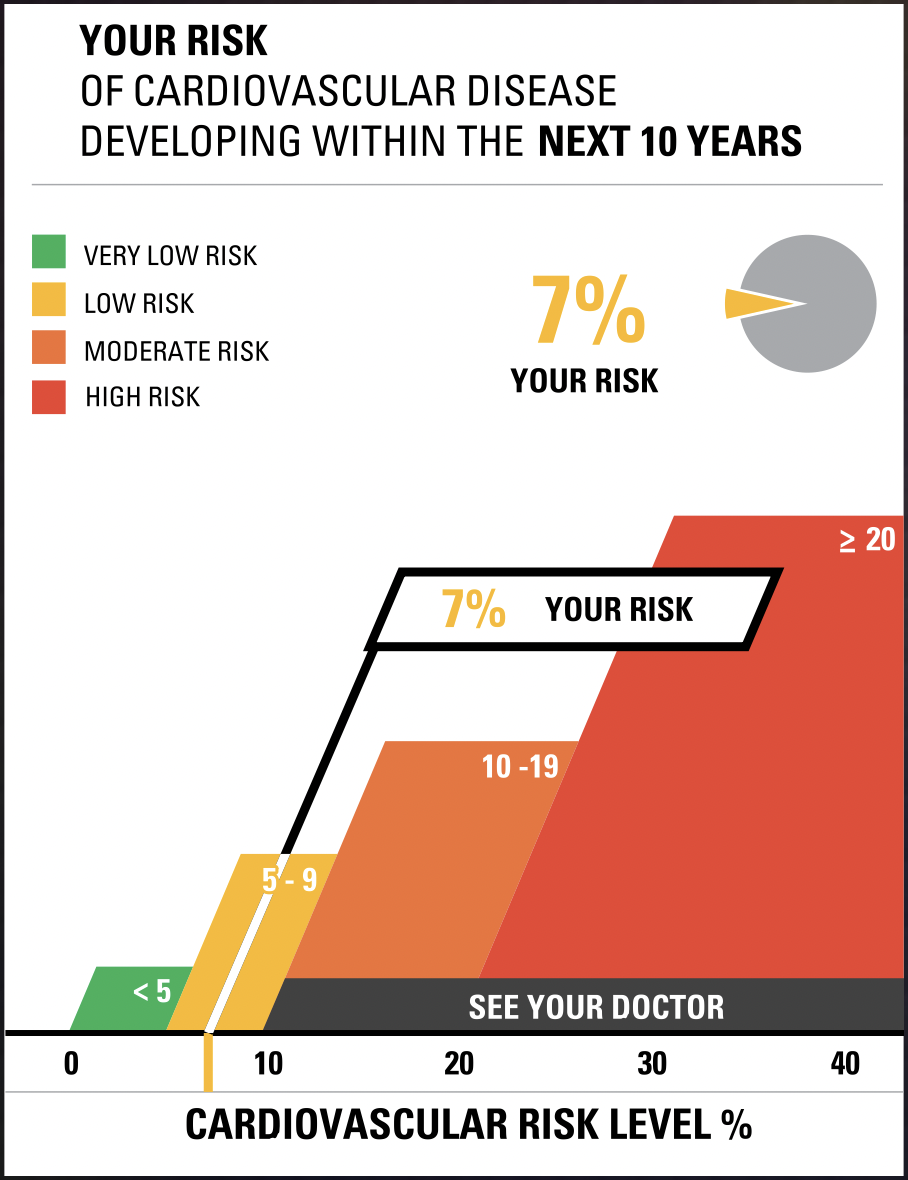
Although many pages of the website are currently defunct, a few useful resources are still functional. vizhealth.org has a built-in cardiovascular disease assessment which after a very brief questionnaire displays your risk for developing cardiovascular disease within the next 10 years. The formula used by the risk calculator was supplied by the Farmington Heart Study, an ongoing research effort which began in the 1940’s. This risk calculator is an exemplary display of interactive data visualization, my results below shows how a professional graph can be produced through engagement from an audience

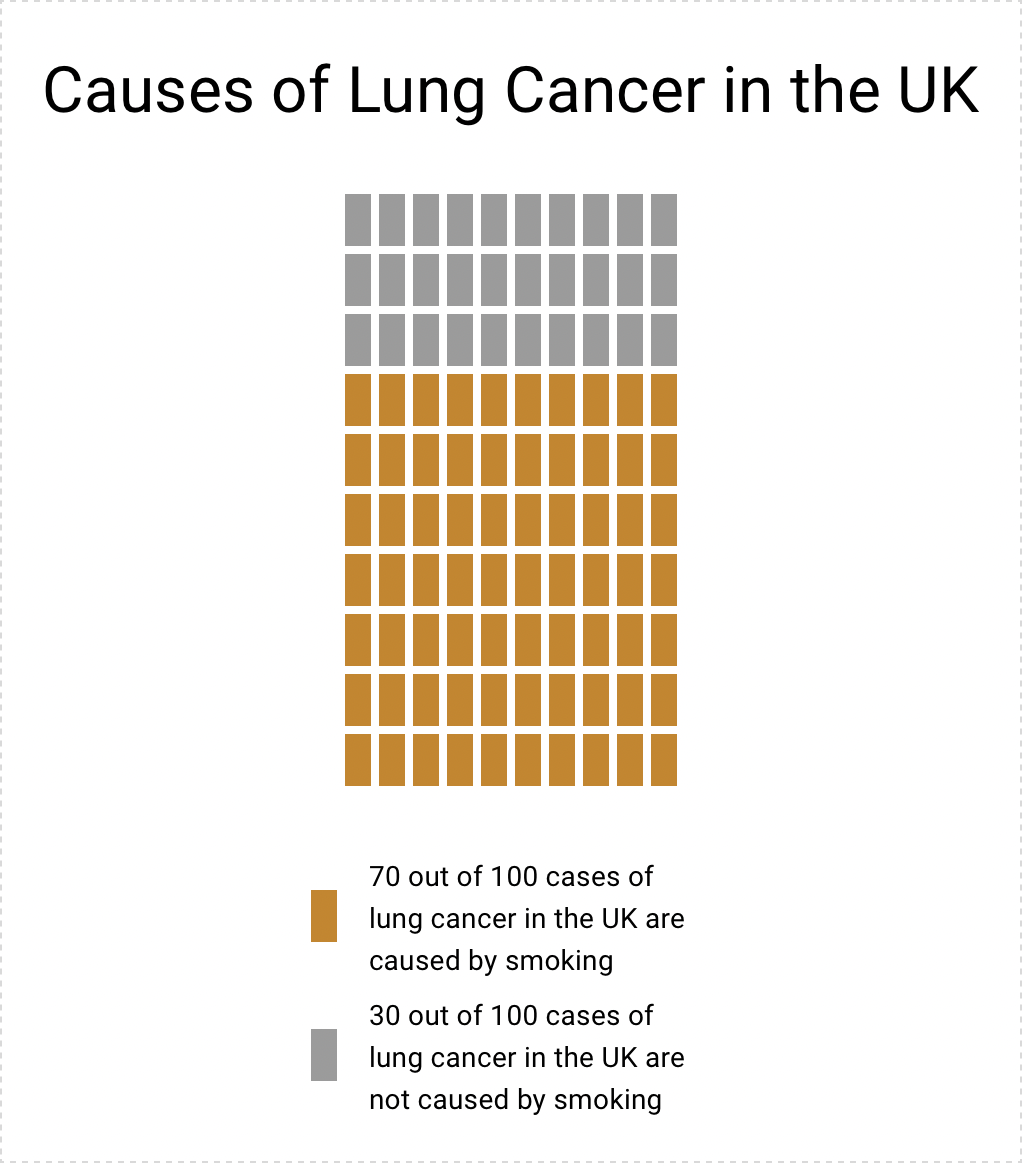
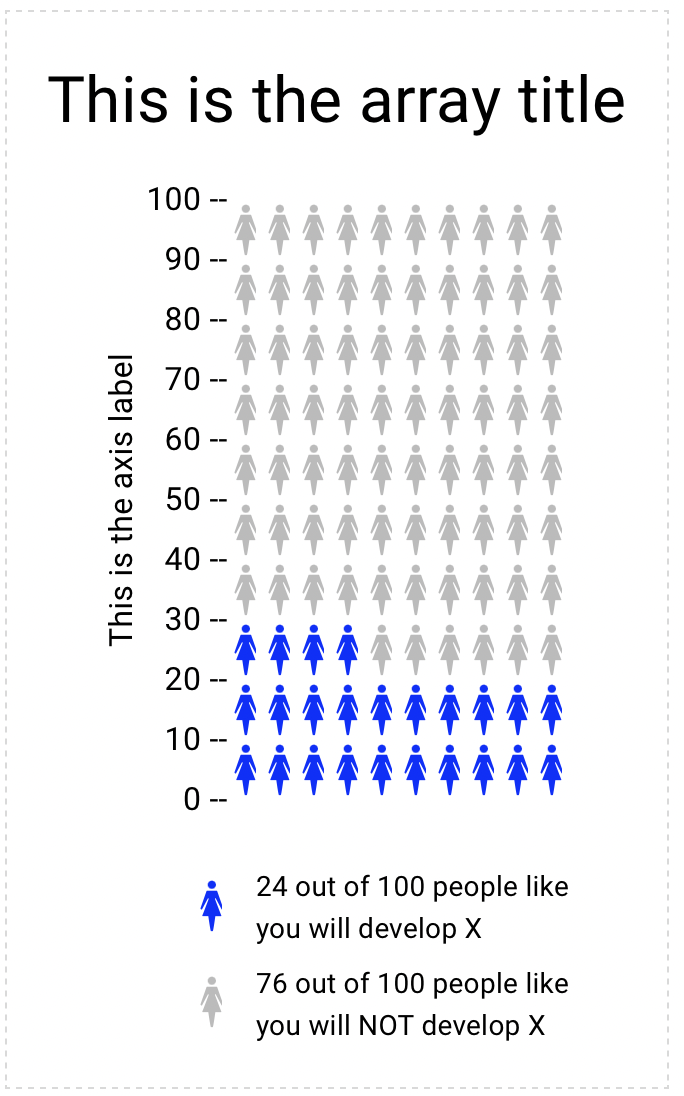
Another useful tool on vizhealth.org is a link to https://iconarray.com, another University of Michigan platform which hosts an interactive icon array visitors are able to experiment with and produce. Below are some examples:


Overall, vizhealth.org provides some useful resources for those interested in data visualization, and is indicative of all the useful tools available on the web.