Link to Image: https://cdns.tblsft.com/sites/default/files/pages/6_after_babylon.png
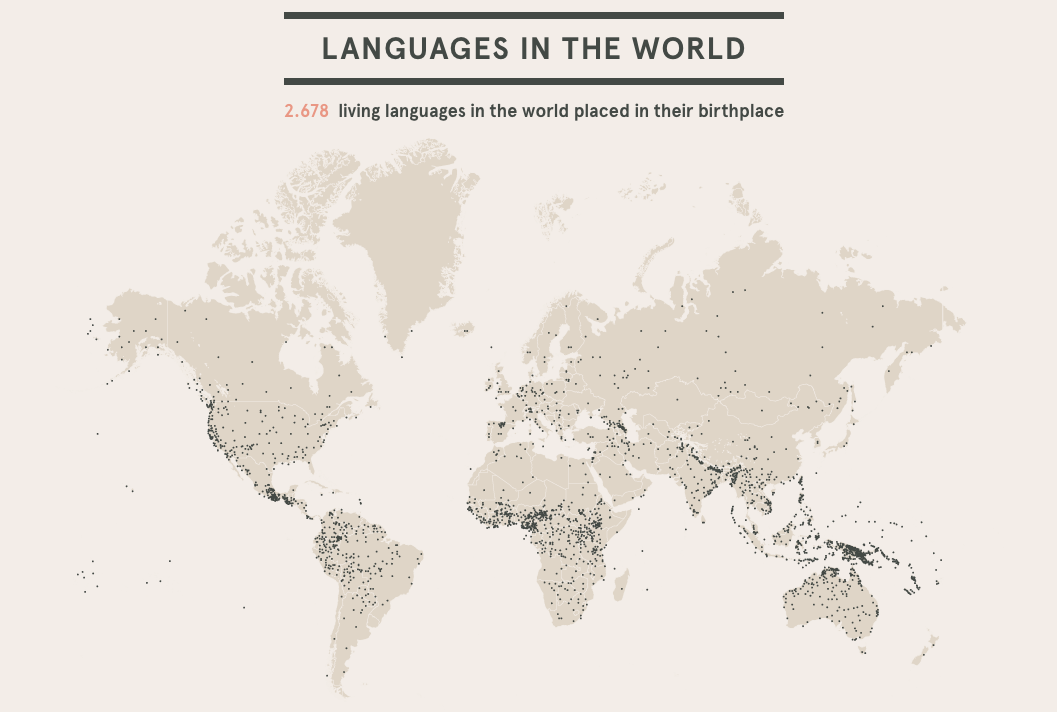
Infographics are an inventive and creative way to share information with others and hold their attention. The beauty of infographics is that there is no specific way that one should look, leaving creators with hundreds of different layouts to choose from. One such way to share information is through a data visualization, as shown above. Data visualizations are a form of infographics that allow a person to share a set of data through one big image rather than multiple facts and smaller images. In the case of the data visualization above, viewers are able to see just how many languages are spoken in the world. The creator of this visual decided that the best way to do this was to use a map of the world, with each small black dot representing the general area/region of the language. A data visualization like the language one puts into perspective how many different languages are spoken not only around the world, but also in a general area or community, which is something that a lot of people may not have been fully aware of before. If the number of languages were just listed in a chart with the region that it is spoken, it may not have been as fully effective as the one above.
The creators of this data visualization are a part of a project known as After Babylon. Their goal, as stated on their website, was to analyze the “current linguistic situation of the world”. The map above was only one of many different maps and graphs shown on their website to help people fully grasp the language situation in the world. One of the brilliant features on their website was to make some of the maps and graphs interactive, making it easier to pinpoint languages and their origins for a full understanding. Overall, After Babylon’s work of the languages in the world using data visualizations and infographics proved just how important these tools are when it comes to sharing information with your audience and keeping them interested in the topic.