https://visme.co/blog/best-data-visualizations/
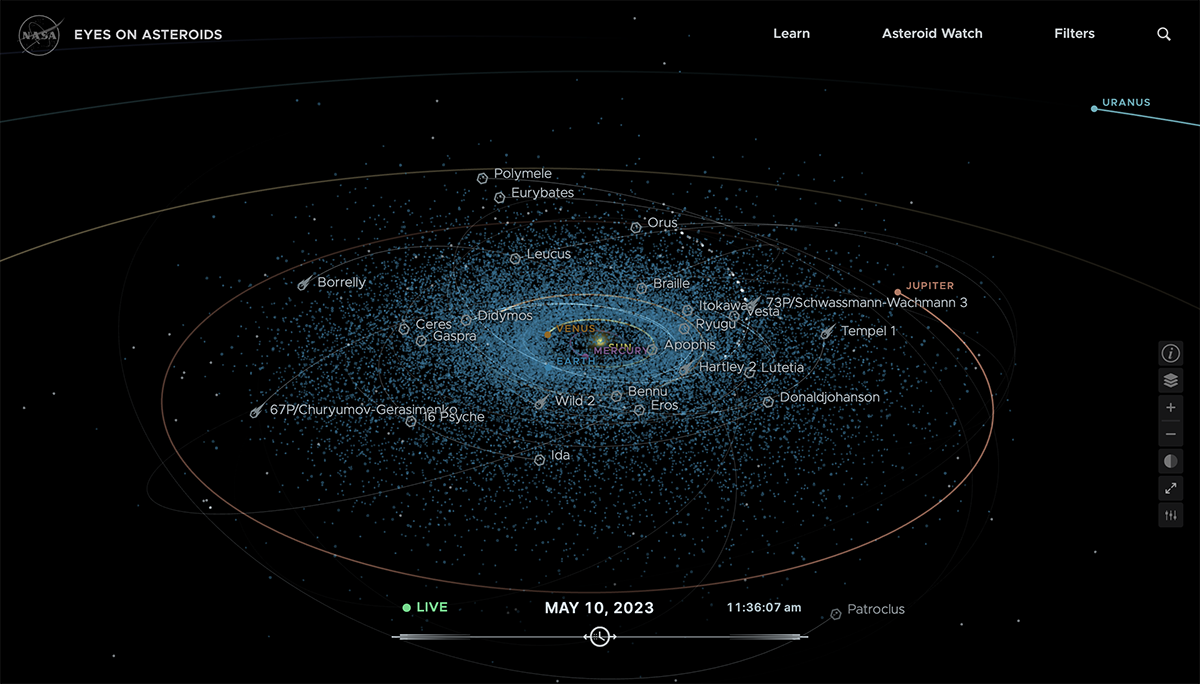
Infographics is an everyday part of our lives. There are many instances where it can be used to aid others in understanding certain complex concepts through the use of visual aids. It can be used anywhere from teachers trying to teach a class about a certain topic, or a marketing firm presenting a new product. One such method that uses infographics includes the use of data visualizations to not only observe but also predict the current course of asteroids in space. According to Visme, NASA’s eyes on asteroids visualizations ” provides up-to date information on the position and trajectory of asteroids”. This means that NASA is able to use the data visualization to possibly see any threats that could be approaching our planet and prepare ahead of time. Furthermore, as shown by the picture above, the data visualization contains a plethora of information about many asteroid paths with their names and projected paths. There are even some planets that are within our solar system such as Jupiter. The abundant amount of information being shown in such an easy to understand manner is only possible because of infographics. To add on to this, there is also a higher chance of the information being shown to be retained by the audience because of its simplicity. It has long been known that people are typically more likely to remember information that leave a strong impression on them, and portraying a 3D real time model of space is definitely one way to do that. However, predicting asteroids isn’t the only thing that infographics are used for. There are also many data visualizations that analyze the social or historical aspects of society such as the seven wonders. With that being said, Infographics is a major resource that can be utilized in many ways in order to learn, retain, and predict information.