Pivot tables can be classified as a data analysis technique that can summarize large datasets and allows one to extract the significance from them. It sorts and summarizes large datasets, automatically.
Below is a typical example of a pivot table:
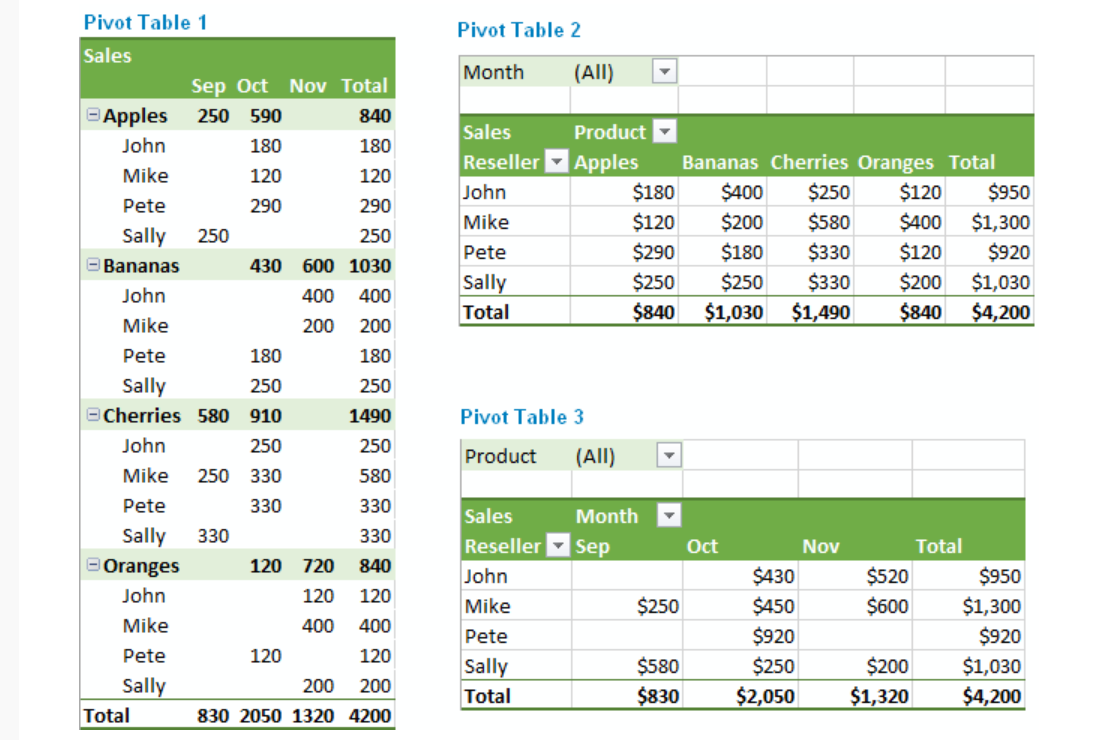
The pivot table above summarizes large data sets, making it easy to comprehend. In pivot table 1 above, the apples are summed up in the fourth column and first row. It categorizes the total number of apples owned by John, Mike, et cetera. Pivot tables may appear to be cumbersome when trying to create them for the first time. However, they are very easy to create once the steps are followed carefully.
There are many uses for pivot tables. The list includes, querying large amounts of data in many user-friendly ways, subtotaling and aggregating numeric data, summarizing data by categories and sub-categories, et cetera.
This link teaches you how to create a pivot table within few minutes.