By: Veronica Perkins
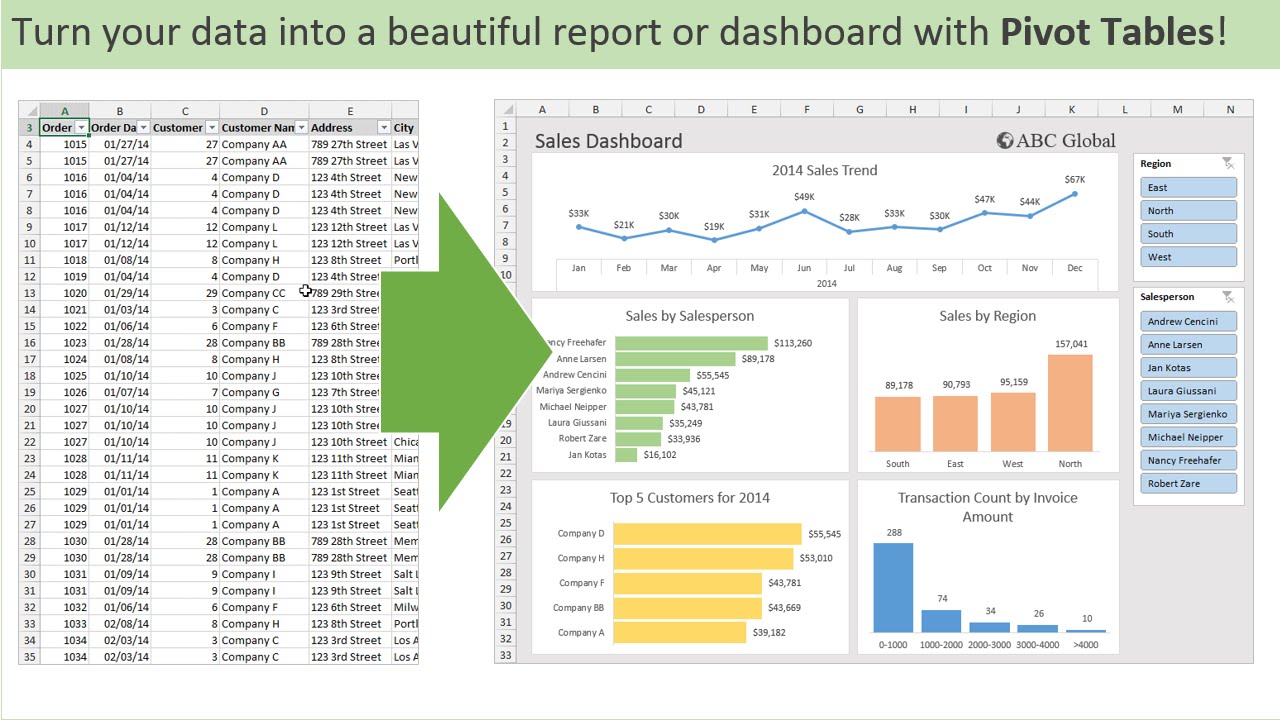
Like any other visualization, the intention is to help visualize the data being presented to an audience. The purpose of a pivot table, is to help visualize and a large amount of data at one time. A typical pivot table looks like this:
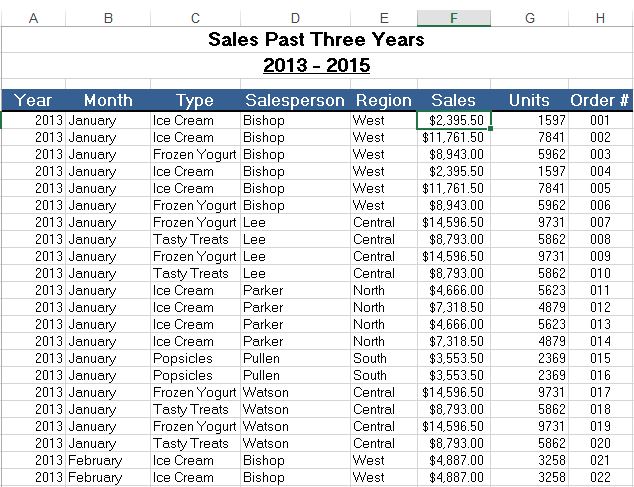
As you can see, a lot of information is presented in the format of a pivot table. This pivot table is an example of how a lot of information is summarized. In this example, the maker wanted to present the sales from the past three years. They decided to break it down between the following: year, month, type (meaning what was sold), the salesperson that sold it, the region of the sale, the sale amount, how many units were ordered and the order number that correlates to the sale. Pivot tables can be so helpful to use because they can help break down a large amount of data at a glance. This information, can also be used to make visualizations to help represent the data.