By John Wickham
One of things that I do when I work on something is to try to put numbers into the things that I enjoy watching. For example, sometimes when I watch an episode of television is tracking to see how much screentime they have in an episode. This helps really show the importance of each cast member in the whole of show. However, until I was unsure of how to best display this data in a form to enjoy, until I read this chapter
The chart below shows the percentage of time each cast member was on screen in the very first episode of Saturday Night Live. The original cast (Laraine Newman, Jane Curtin, Dan Aykroyd, Garrett Morris, Chevy Chase, Gilda Radner, John Belushi and the short-term cast members George Coe and Michael O’Donoghue) was a boom in the 70’s comedy scene. Without them, both comedy and modern SNL would not exist to this day. However, it is hard to get a picture of the impact on the actual show.
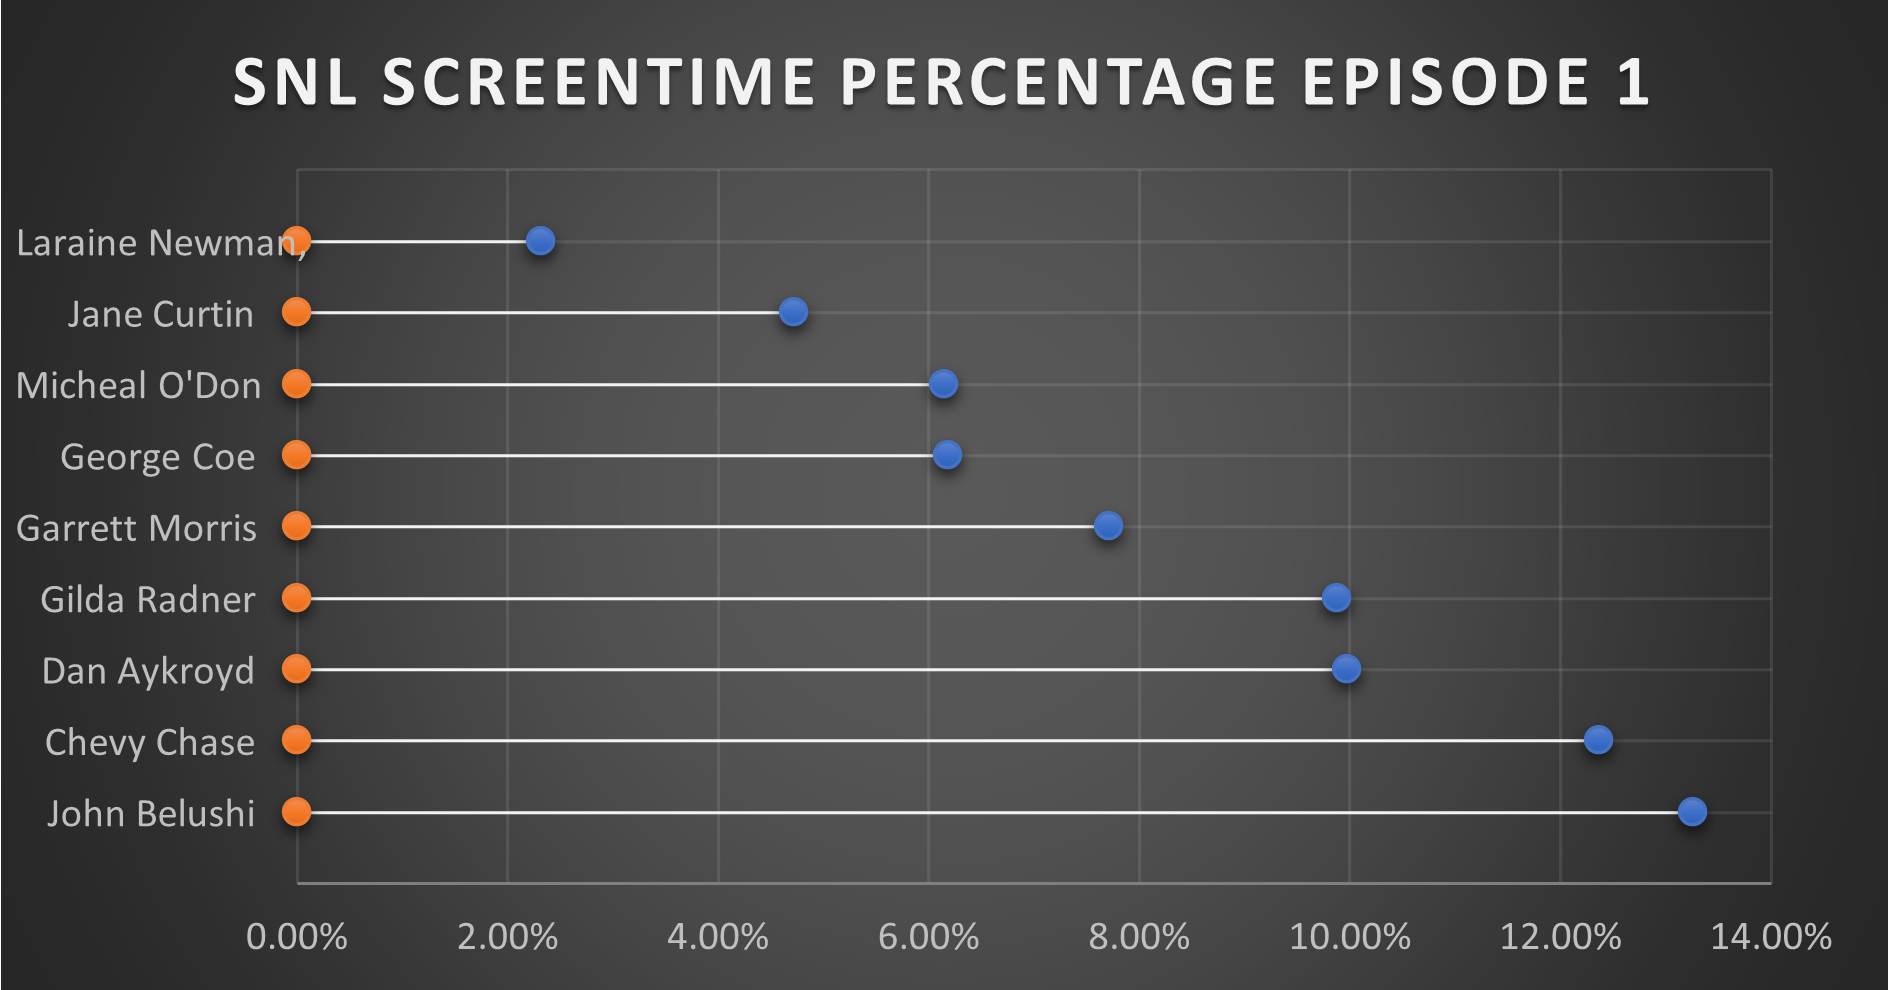
This is where this chart comes together in a quantitative fashion. From the data, you can see that John Belushi, Chevy Chase, Dan Aykroyd, and Gilda Radner where the frontrunners right away. Those would be the major stars on the show, and even in episode 1, the show had some faith in them. The other cast members had some work.
It is interesting that George Coe and Michael O’Donoghue (cast members who would be off the show in episode 5) had a decent amount of screen time in these first episode. Even more than long-term cast members Jane Curtin and Laraine Newman. It is a very interesting figure in the history of Saturday Night Live.
You can watch the first episode of Saturday Night Live on Peacock.