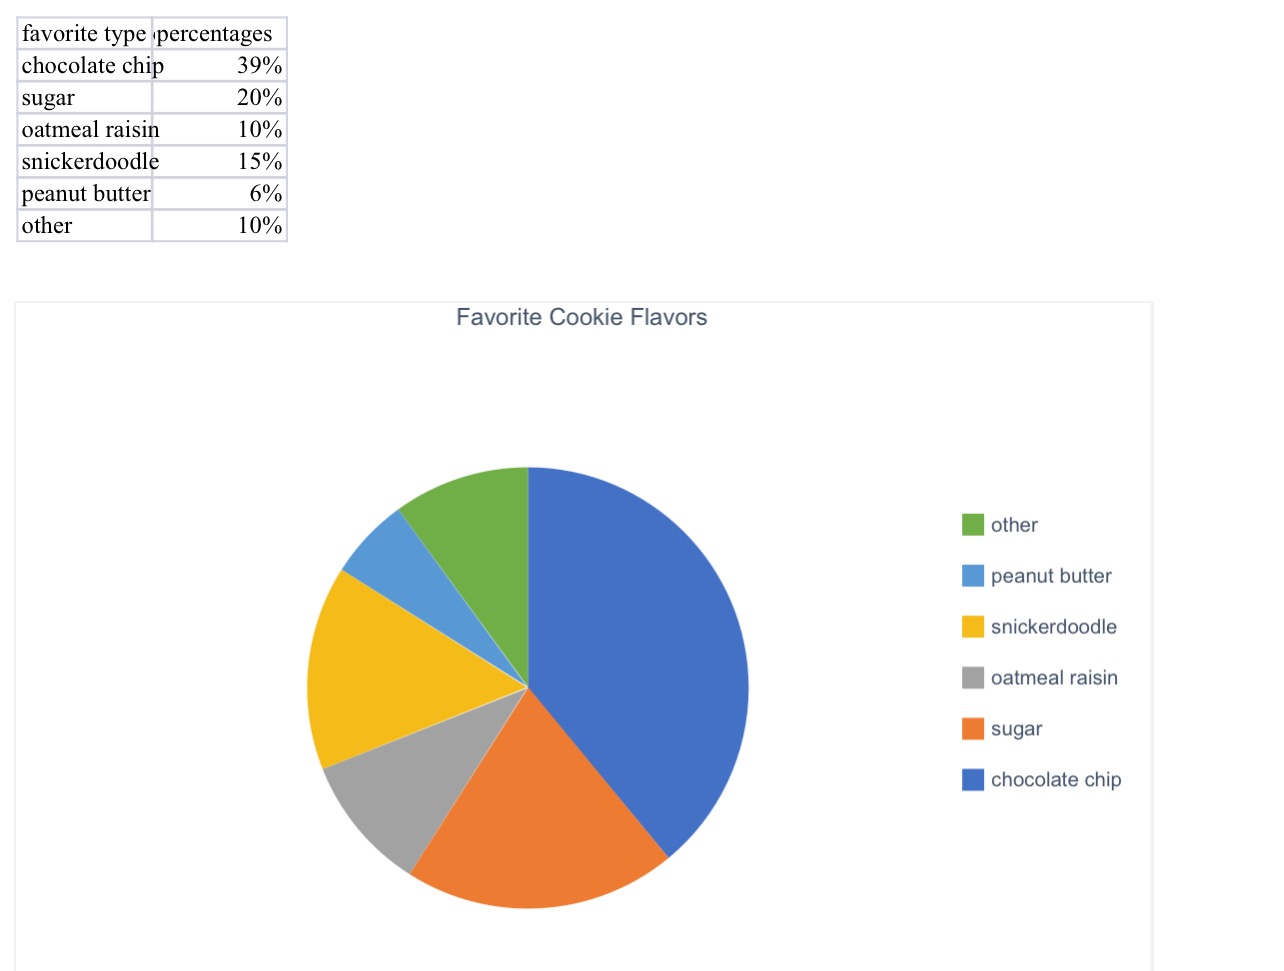
Here is the pie chart that I created for a group of people’s favorite cookie type. I think a pie chart would be the best for this because it is measured in percentages. If we were measuring it by exact number of people, we could have used a different chart or graph.
Pie charts are very fast and easy to make. All you need for a perfect pie chart are some labels, color, percentages, and data!
(The percentages inside the pie chart will not upload onto this website, but it is on the excel document attached to my assignment on blackboard!)