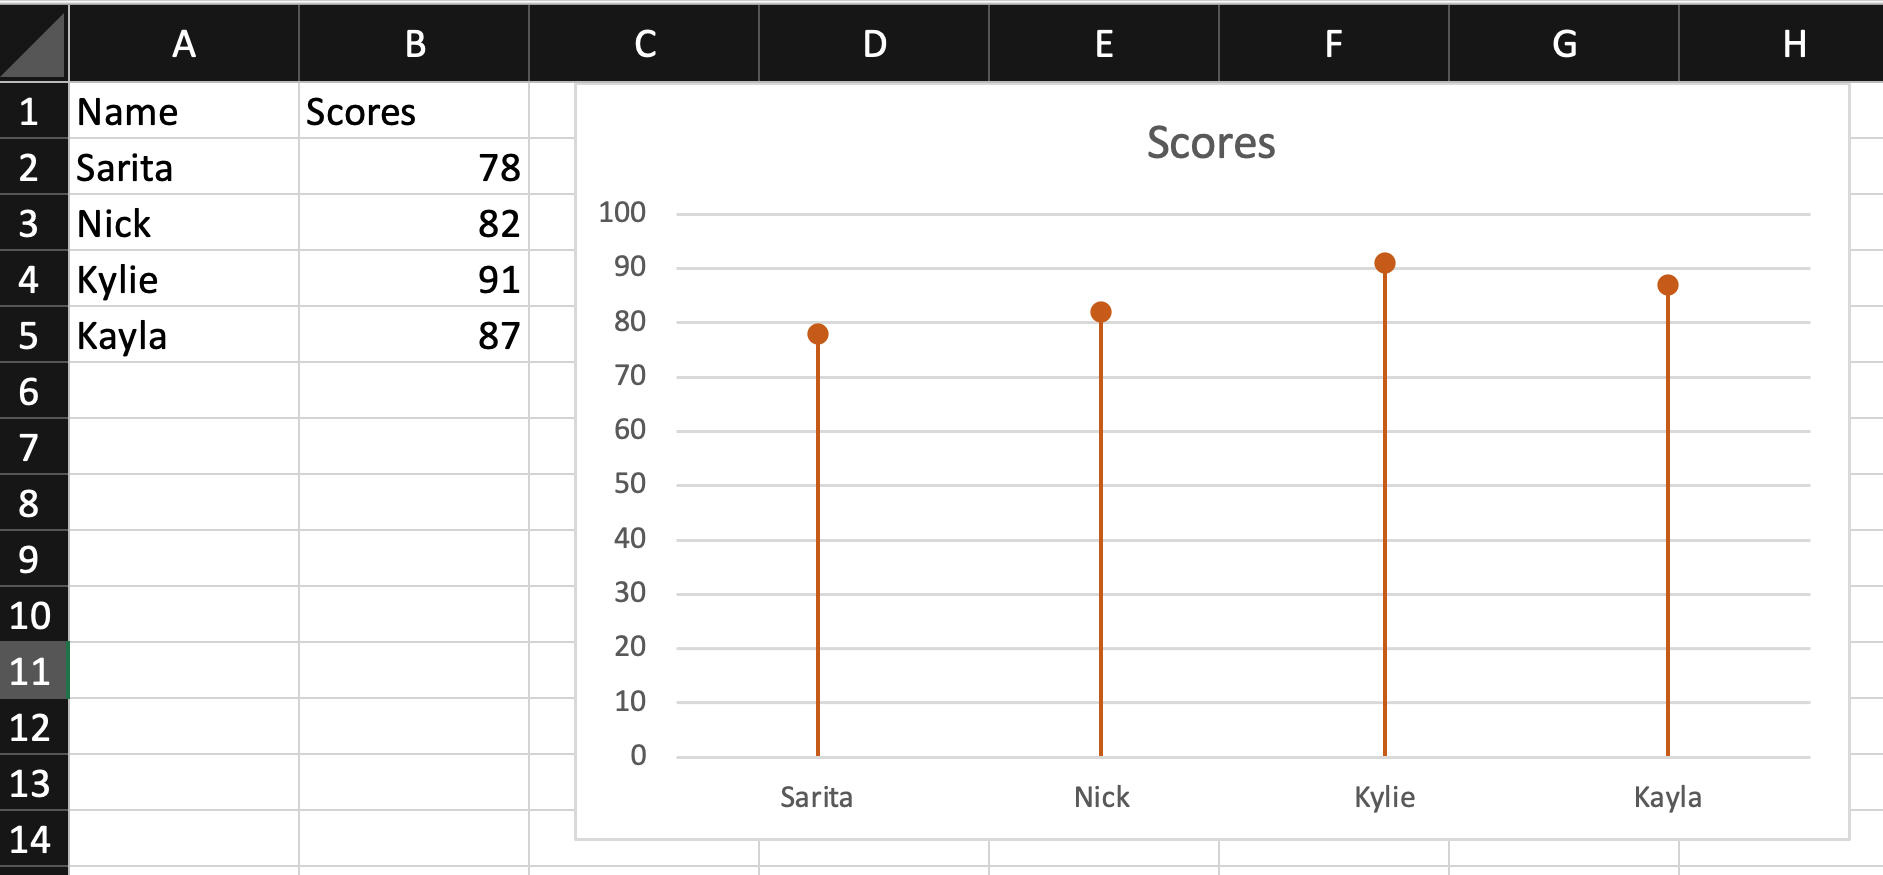
After making my own lollipop chart, I can see the appeal of using that instead of a bar or line graph. The traditional line or bar graph has been done countless times, using this graph changes that up and creates an easy way to display data. Bar graphs can sometimes be clustered when a lot of data is being presented, varying in length. This type of graph can make it clearer to the reader and free up space.