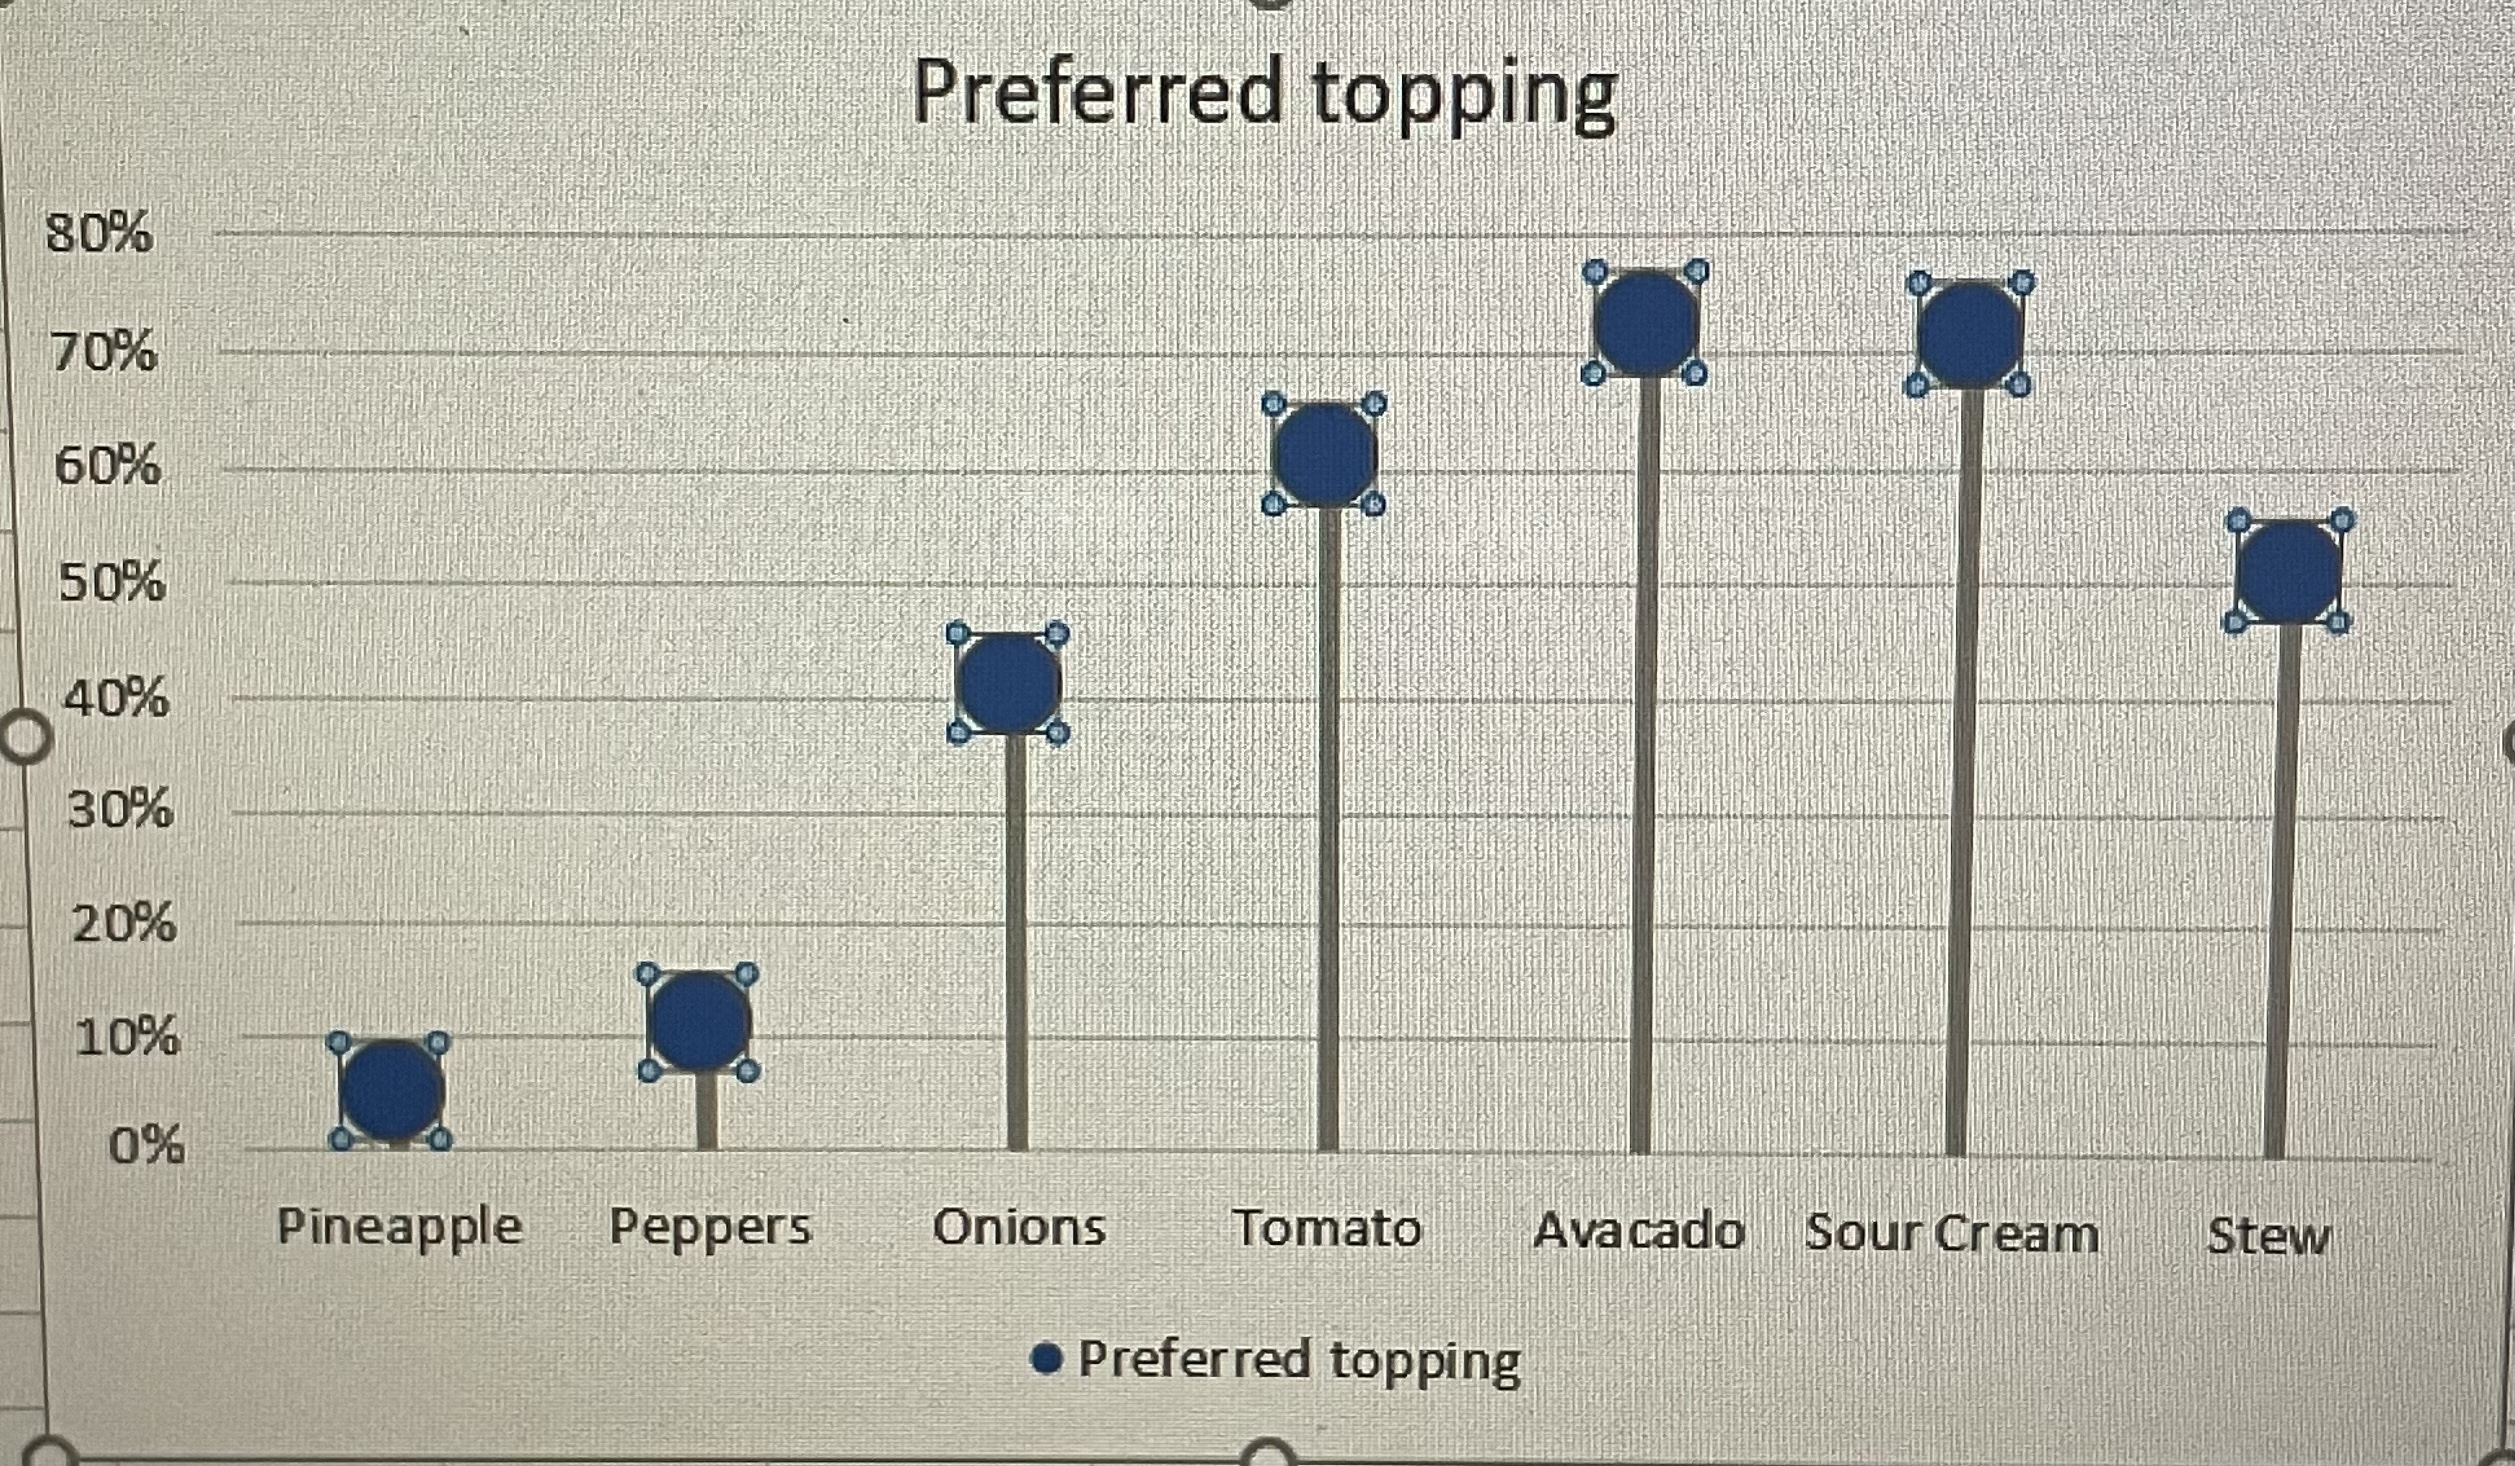
A lollipop chart is a different variation of many graphs and visualizations one can use. It’s just a line and a dot, instead of the typical bar. Visually similar to a lollipop. Lollipop graphs are useful for measuring trends, categories, ranking, and comparing data.
Here is an example of a lollipop graph, my own created lollipop graph.
Hi! I really enjoyed your lollipop chart! Toppings were a very creative idea! I agree with you on how lollipop charts are similar but just different variation of. a bunch of other charts/graphs.