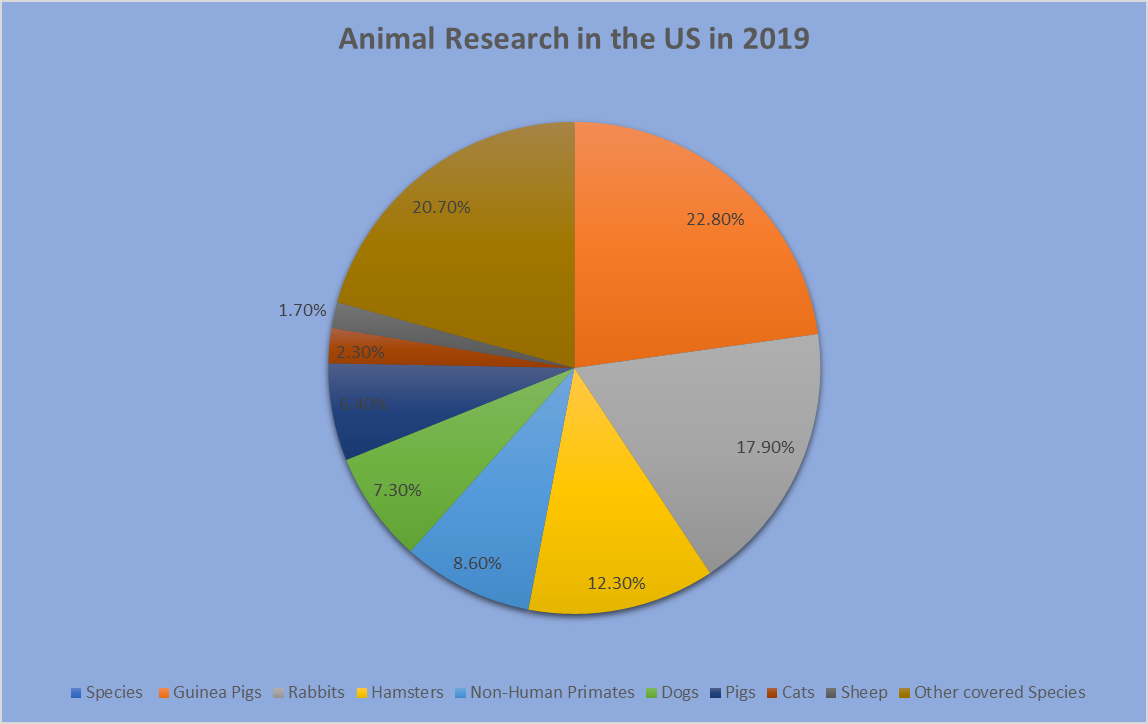
I employ the pie chart to display this set of data simply because, the article and data set diplayed in a table took a little more effort to discript. However, once the data was implemented into the pie chart the information became a lot simpler to comprehend.