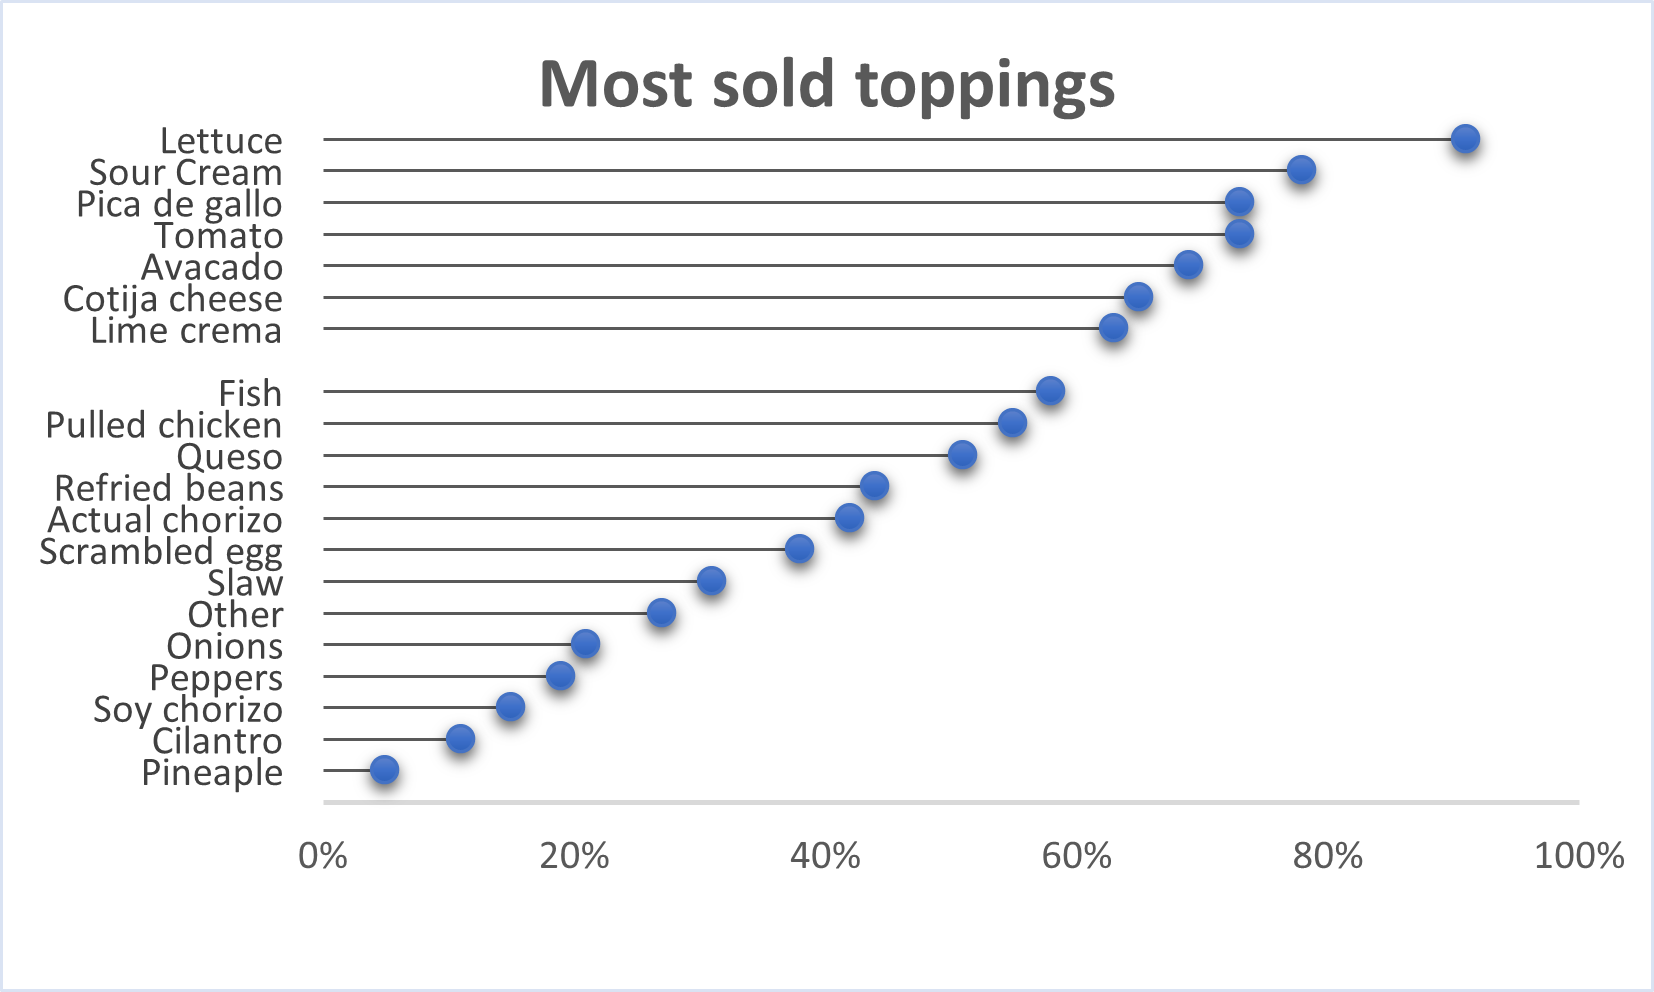
The lollipop bar graph is employed to create an opportunity to take a overwhelming traditional bar graph and simplize it’s data. The inforgraphic below exemplifies this by presenting customers topping preferences in the lollipop variation.
The lollipop bar graph is employed to create an opportunity to take a overwhelming traditional bar graph and simplize it’s data. The inforgraphic below exemplifies this by presenting customers topping preferences in the lollipop variation.