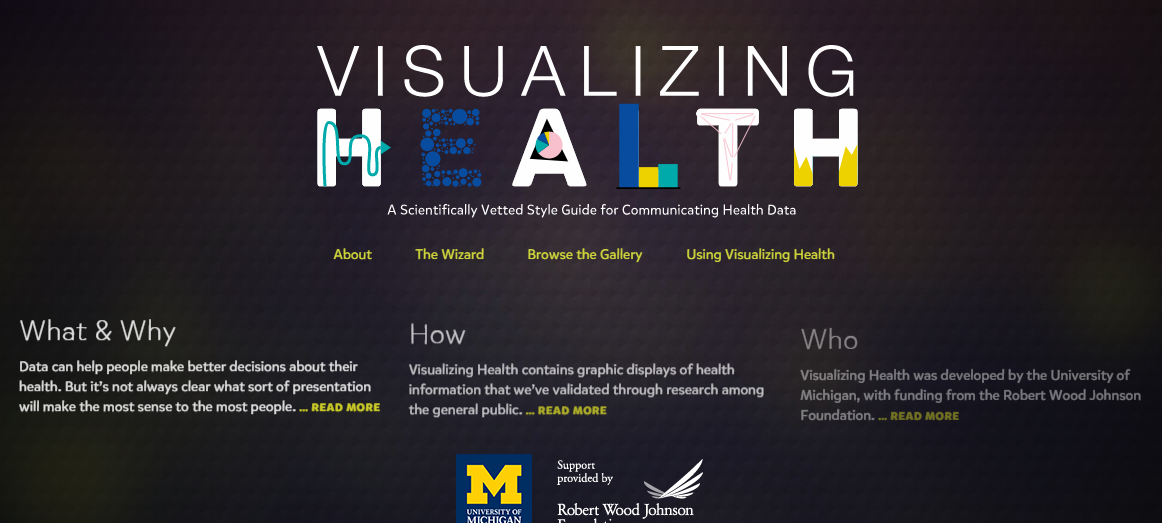
An interactive website that helps pair visuals to medical information thus making it easier to communicate with patients. The website itself is well organized and is easy to navigate; The University of Michigan also lays out its goals and objectives for the website on the home page.

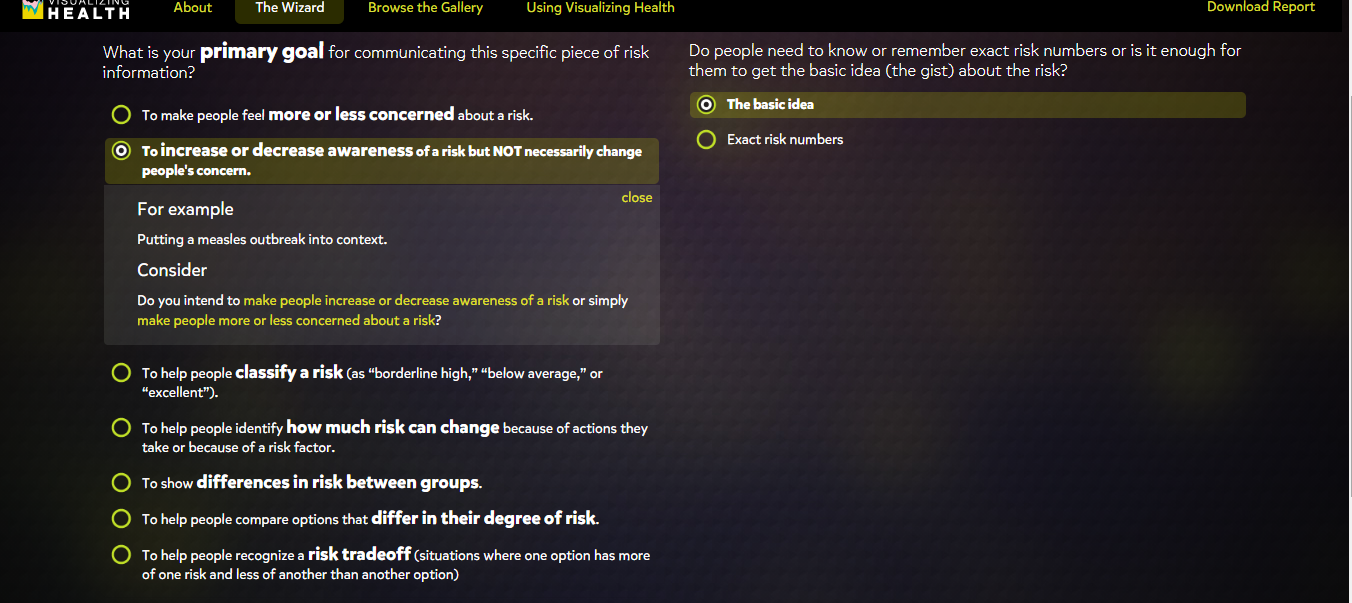
As I navigated through the website, I found a tab labeled “The Wizard” which asks two questions to help guide users toward an image that helps display the information they want to transmit.

Once past the questions on “The Wizard” then the site guides you to a page that displays multiple colorful images to the right and down the left-hand side is a widget that a user can elaborate more on what they are looking to create.

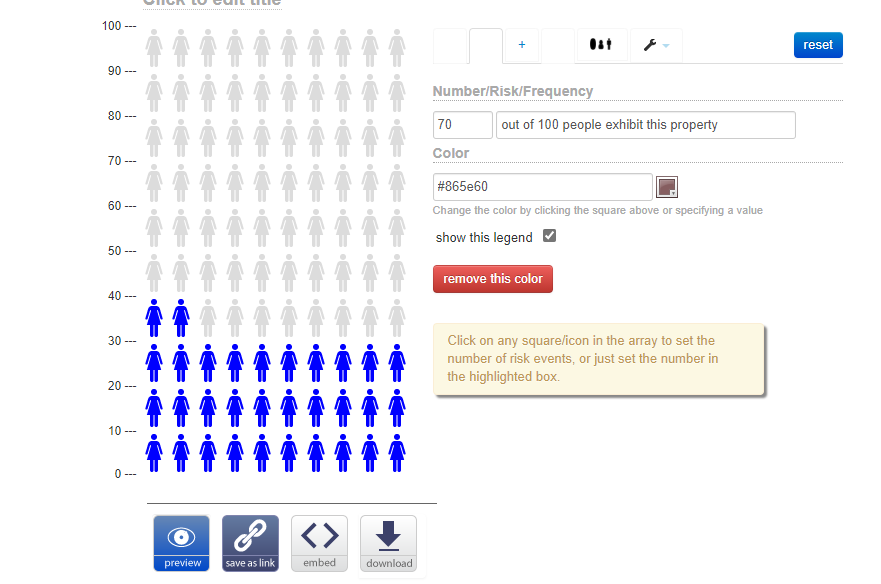
The generator was for Icon array, which transferred you to another website. On the page, ironarry.com, there were a few questions listed that help generates an icon graph, like posters seen in a doctor’s office. The generator also had options of changing the icon on the chart, male, female, etc.

Being a new user to this website, I decided to try out the calculator, it asked a few simple questions and within seconds I had an easy-to-read visual before my eyes. I was honestly surprised by how simple the chart was to read and I think it is a wonderful tool for people like myself who are usually confused by all the charts and analyze from a doctor’s office.

Overall, I think this website could be helpful to not just medical professionals or patients but to those who are trying to understand and grasp the concept of visual data. I feel like it explains and shows how each type of graph can portray specific knowledge and be used to target consumers in a simple and understandable form. I think what helped me tie in how well visualization can help the brain compute data was manipulating the data on the graphs and seeing it come to life, so to speak, in graph form. Even using the calculator, I was able to insert data I did not quite understand and receive an image that got straight to the point with little to no confusion.