Categories
Data Visualization and Art Sankey Diagrams

Energy Usage in the US

Energy consumption is a major issue in the United States that spans across multiple topics, from the oil industry’s environmental impact to the debate over alternative sources such as nuclear power and hydro dams. Yet, most Americans are largely unaware of how much energy gets consumed daily, focusing more on where the energy comes from.
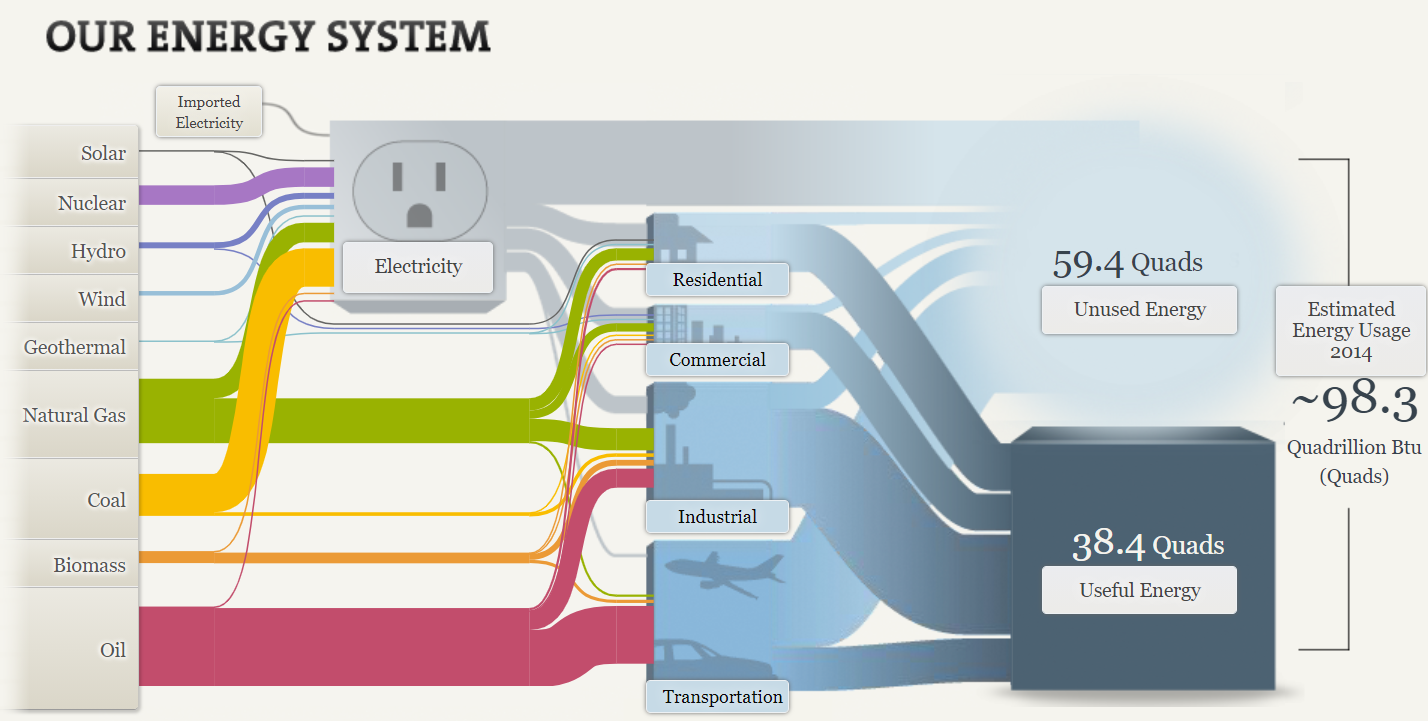
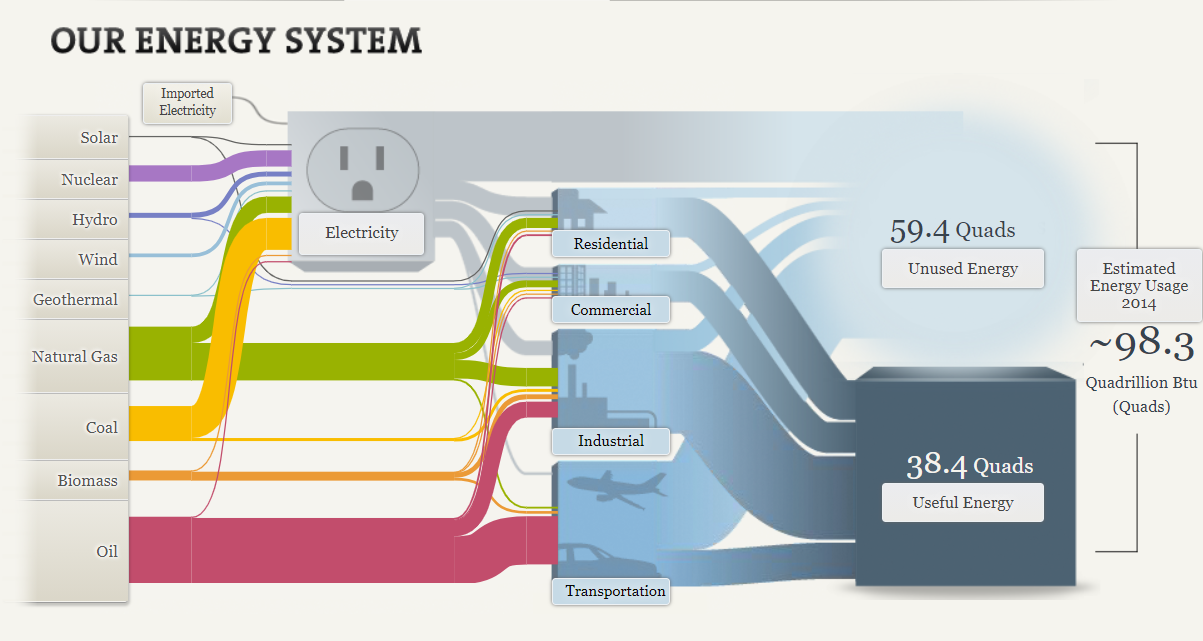
The National Academies of Science, Engineering, and Medicine compiled a Sankey chart depicting America’s energy usage in 2014. Much to my surprise, about 60 percent, or 59.4 quads, of generated energy went unused. Clicking on each point in the Sankey chart brings up a tooltip containing details about each source and how much energy gets used.
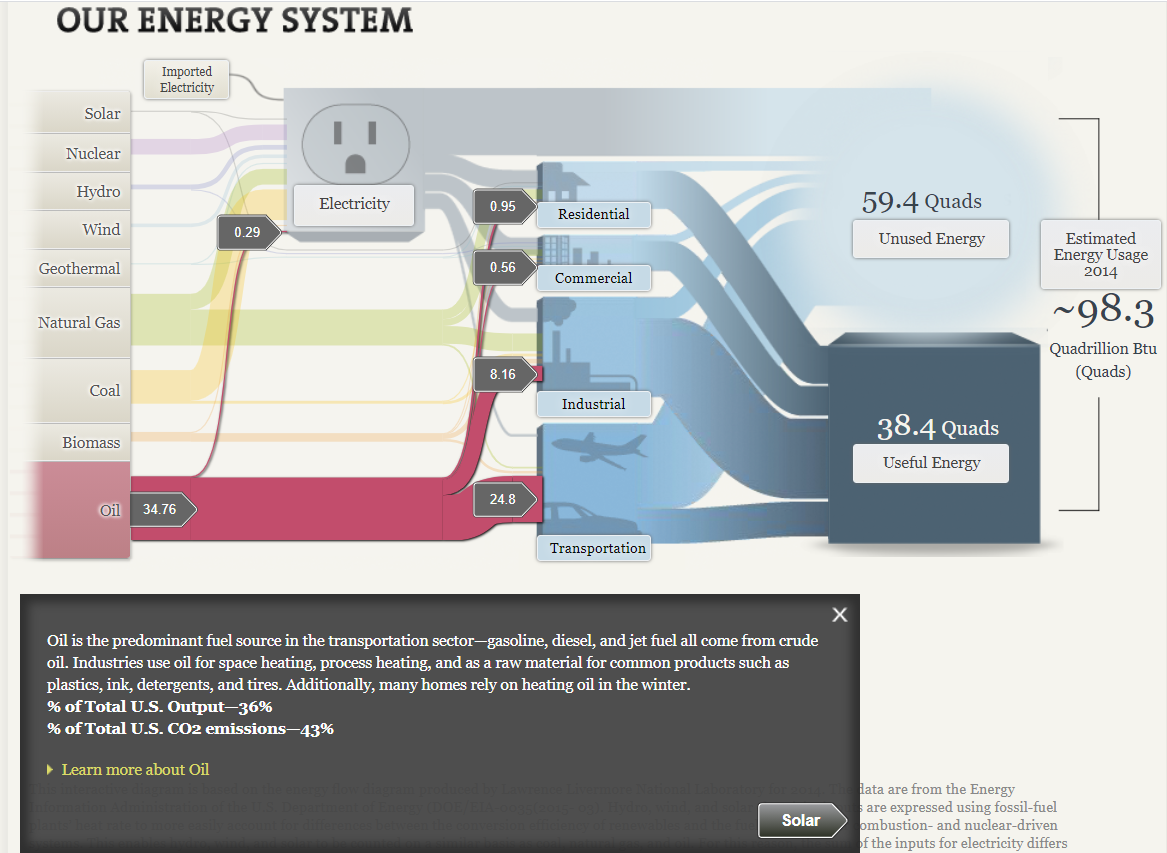
Unsurprisingly, petroleum products were the largest energy source in 2014, primarily used in industry and transportation. The second and third-largest energy sources were natural gas and coal, both of which were converted into electricity to power residential homes, commercial and industrial businesses.
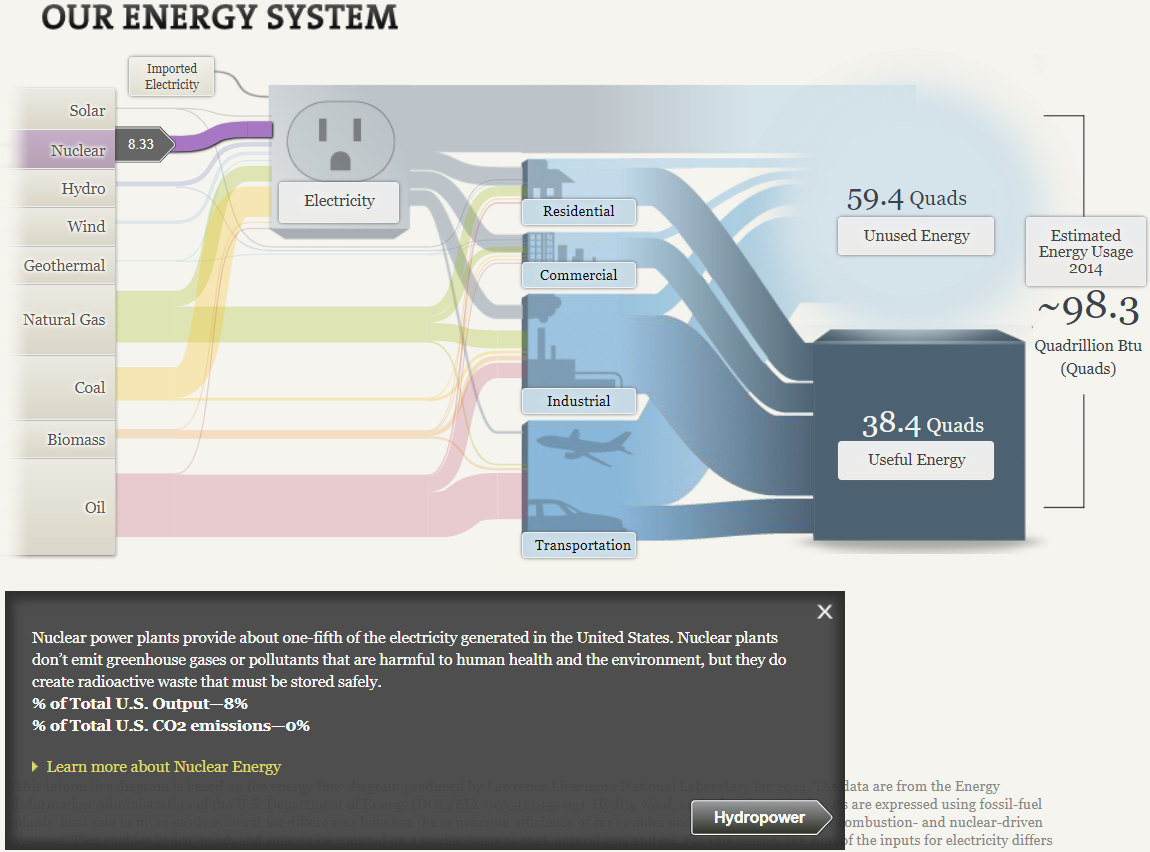
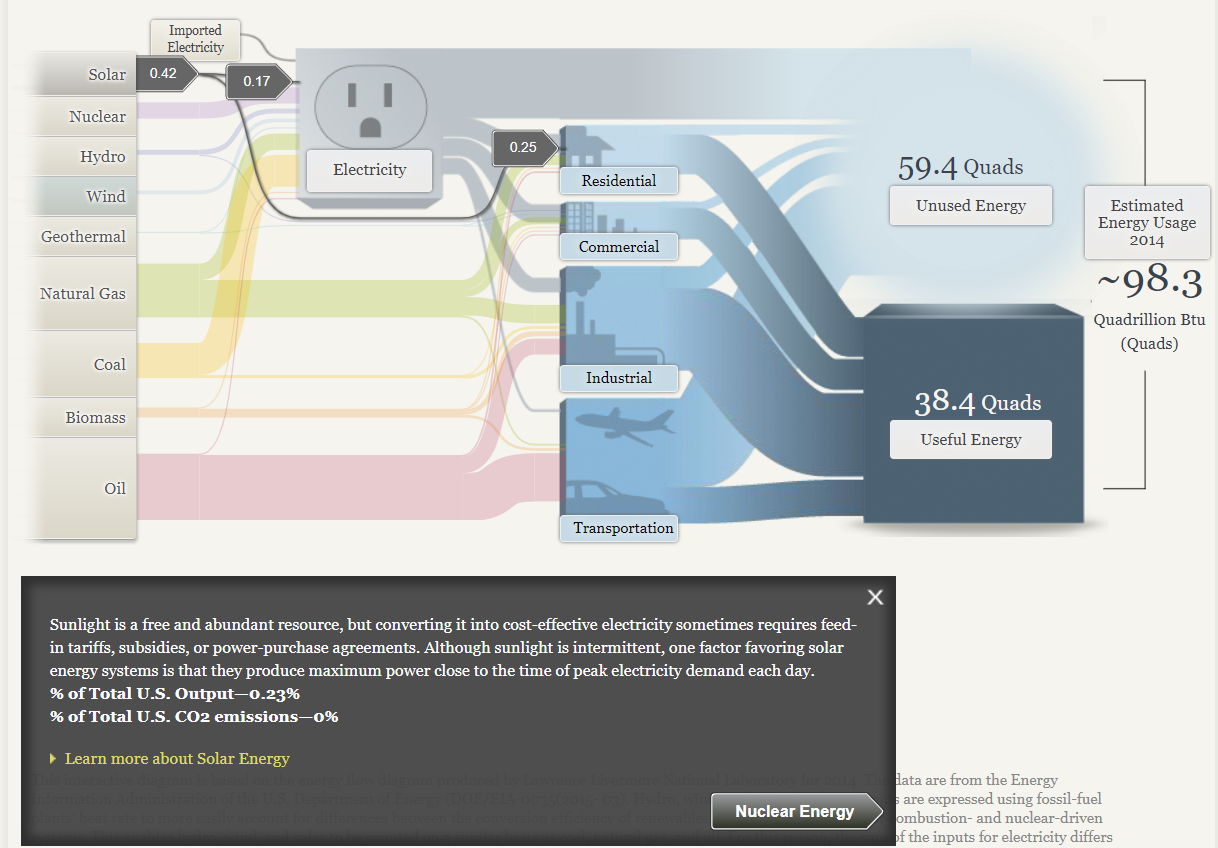
Nuclear energy is possibly the most controversial alternative energy source due to its implications in disaster events (Chernobyl in 1986, and Fukushima Daiichi in 2011) and the nuclear arms race. As the tooltip states, nuclear energy provided one-fifth of the nation’s electricity. While they don’t create any carbon emissions, radioactive waste from the power plants is still a health hazard. Additionally, opponents of nuclear power cite the potential for these power plants to be weaponized or targeted by terrorists if the health risks involved in handling radioactive materials aren’t enough to raise concern.
Categories
Sankey Diagrams

Our Energy System Visualized Through A Sankey

The National Academy of Sciences uses Sankey visualizations to explore our nation’s energy system. Although this type of visualization may be unfamiliar to many of us, Sankeys allow us to visualize flow when there are multiple inputs and outputs, which is why it is a perfect visualization to use when mapping out our nation’s complex energy system.

Based on the thickness of the various colored flow lines depicted in the picture above, you can easily see that oil, natural gas and coal are the nation’s leading sources of energy. The inputs (energy sources) then flow into various outputs (energy uses such as residential, commercial, industrial, transportation and electricity). We can see that the majority of oil is used for transportation purposes while coal is used for electricity. This visualization is also interactive. By clicking on some of the textboxes you can find more detailed explanations about that topic.

Clicking on “Unused Energy” brings up a text box with an explanation of why some of the energy we produce is lost.

Separate visualizations are also provided for a regional energy system (MD, OH, PA and WV) as well as visualization for California state’s energy system.

Sankey showing the energy system for MD, OH, PA, WV region. It is interesting to note that coal is the largest energy source for this region. Only a small amount of oil is produced in this region which is why the oil is imported.
Sankey showing the energy system for California. Coal and natural gas are the largest energy sources for the state of California while coal use is almost non-existent.

In conclusion, depicting the various energy systems in the United States through use of a Sankey visualization seems to be a great choice. Color coding the various inputs or energy sources allows the reader to quickly decipher which color belongs to which energy source. Since there is also a significant difference in oil, coal and natural gas usage compared to renewables such as solar, hydro, wind and geothermal, it was easy to recognize which sources contributed most towards our energy system and which contributed the least. Furthermore, the reader could easily see how each sector (residential, commercial, industrial, transportation) contributed to either useful or unused energy since these were depicted in starkly different colors.

Categories
Uncategorized

Our Energy System

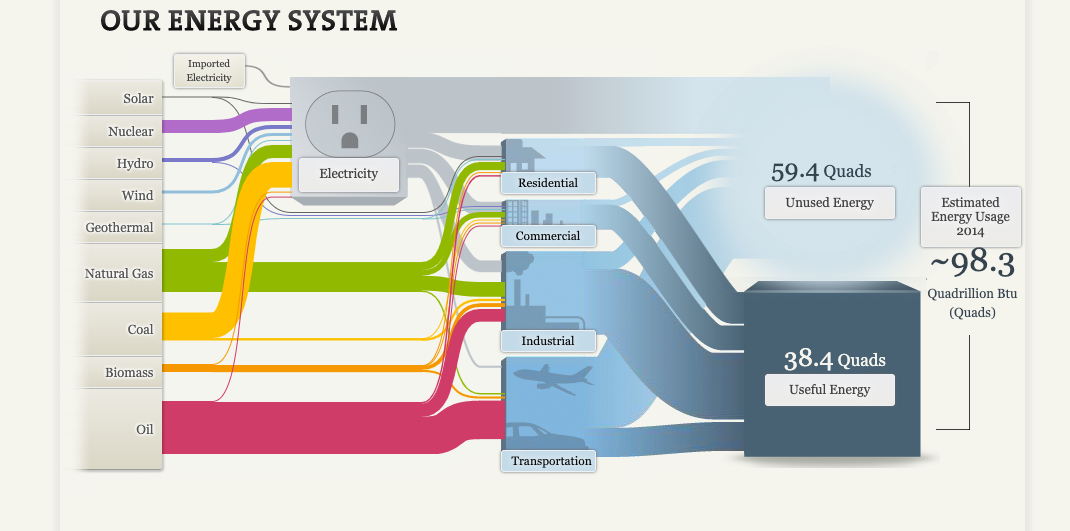
This week I had the pleasure of looking into the inner workings of the US energy system through the National Academies of Science, Engineering, and Medicine. Their approach to visualizing US energy production through the use of a SANKEY graph, pictured below, was very unique but fitting at the same time.

The beginning phase of the graphic already does a lot to convey the basic functions of the energy grid and the its various aspects. The flow from source to energy use is very natural and lends itself well to establishing the fact that the generated energy has to be moved through various stages before reaching its intended destination. When combined with the useful and unused energy figures, it establishes that there is some inefficiency in our current electrical grid that will lead to energy losses during transmission and that our current generation sources are not as efficient as we might believe.

The option to expand the tabs on the left to access more information is useful as well. It helps keep the main space of the graph from becoming too cluttered with information. The breakdown of where the energy goes in terms of electricity and other uses is cool too, as it helps show off the fact that not all energy produced in the US is directly used for electricity generation. Some may be used for industrial process or for other applications like heating for homes an businesses in the case of oil and natural gas.

Overall I found the SANKEY graphic very fitting for this kind of information, but I can see it having very limited usefulness anywhere else. It seems like it would only be a good fit at describing processes that flow naturally from one step to the next.

Categories
Uncategorized

SANKEY

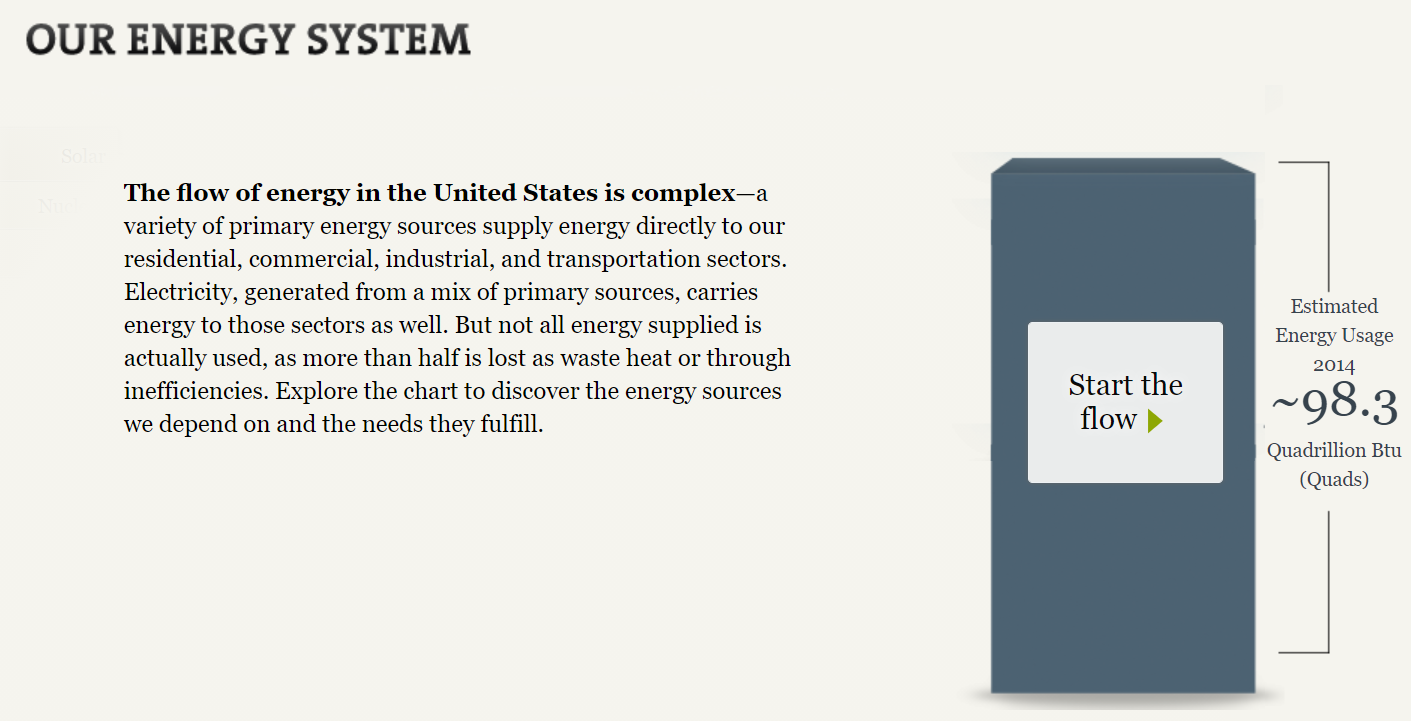
This website is an excellent tool for those collecting data that concerns the U.S. primary energy sources. You are greeted by a bar graph visualization portraying the “start” button for the visualization but also some insightful information about the energy usage in 2014. While this is not a lot of information to start with, it is enough to entice the audience to delving into the presentation further.

Once you begin the presentation you are greeted by the following visualization pictured below!

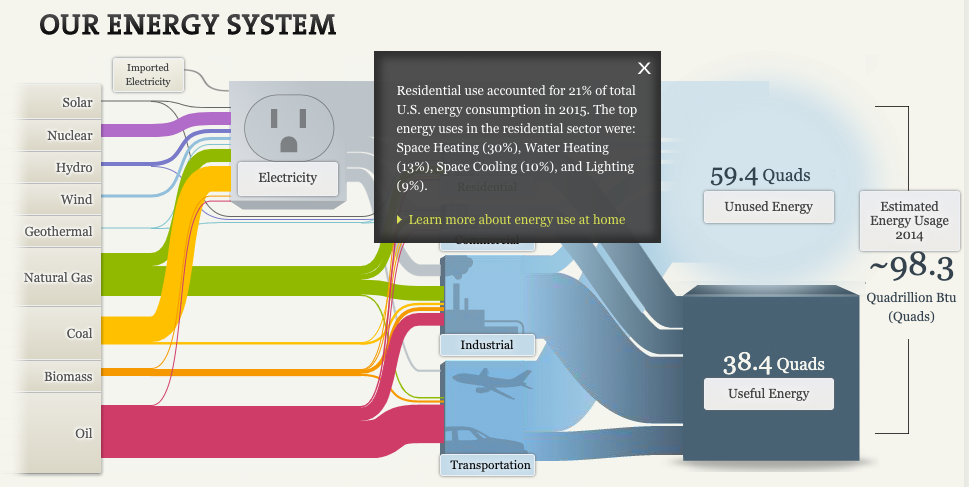
The above visualization contains a lot of information to say the least! The very first thing I notice about this visualization are the colors. Pictured above you see the colorful “cords” on the left hand side of the visualization, and blue tubes on the left. The colors in this visual do wonders to help the audience interpret each individual topic. However, this visual would not be very useful in a presentation where the presenter did not wish to explain this visual. This is because the audience will need some context of where to look on the visualization and why for the presentation. Each topic on this visualization is also a link to a different screen containing data and visualizations concerning the topic selected.

For this blog post, I choose to delve into “residential” energy use. As seen above, a small pop-up appears containing a more information on residential energy use within the U.S. How crazy is it that the residential energy use accounted for 21% of the total amount of U.S. energy usage!?

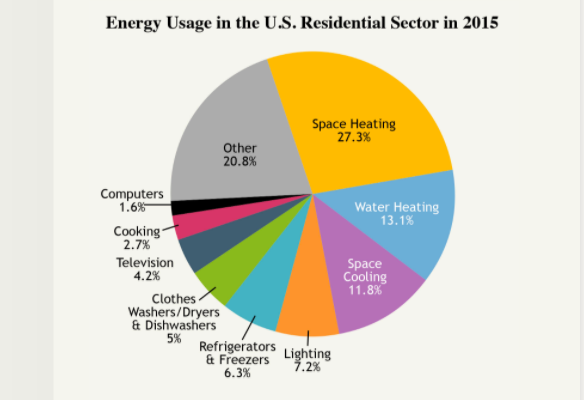
Once navigating to view more information about U.S. residential energy usage, I found this pie chart visualization. In 2015, the largest contributor to U.S. residential energy usage was space heating (27.3%) followed by water heating (13.1%). Space cooling (11.8%) came in third and was followed by multiple other factors that contribute 8% of less. I do think this visual was effective in communicating what it needs to. However, I do feel that the colors distract from each individual topic. I think this would be more effective to use the pie chart to point to one colored factor (such as space heating) and leave the other factors in a grey/ neutral tone.