Categories
Data Sets Data Visualization and Art Pie charts

Pie Charts

Pie charts are useful for depicting parts of a whole in a dataset. However, most people think that pie charts are a one-size-fits-all solution for data visualization, often making a visual mess of the data or telling a misleading story about its message.

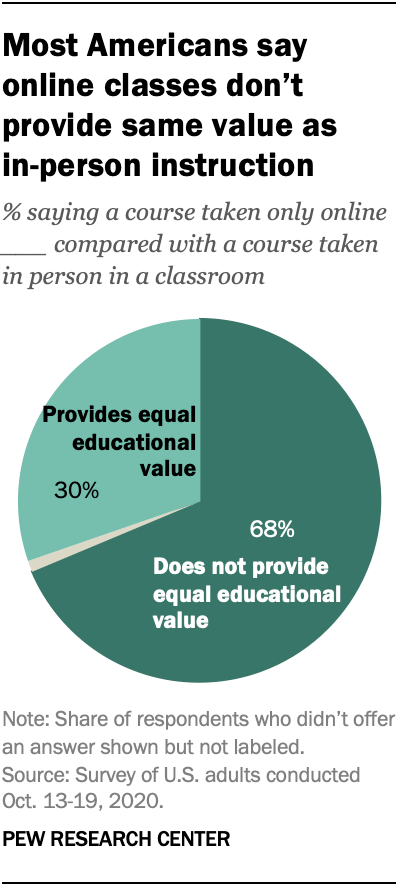
Recently, the Pew Research Center published a report about the value of online instruction in the wake of the ongoing COVID-19 pandemic. The majority of participants in one study covered in the report say that online instruction does not have the same value as in-person instruction.
Source: Pew Research Center

Looking at the pie chart above from a design perspective, the researchers used a darker shade of teal to depict the majority opinion. In comparison, the lighter shade shows the minority opinion. The pie slice that is greyed out represents the 2% of survey participants who did not answer or had no opinion.

Pie Charts Related to My Interests

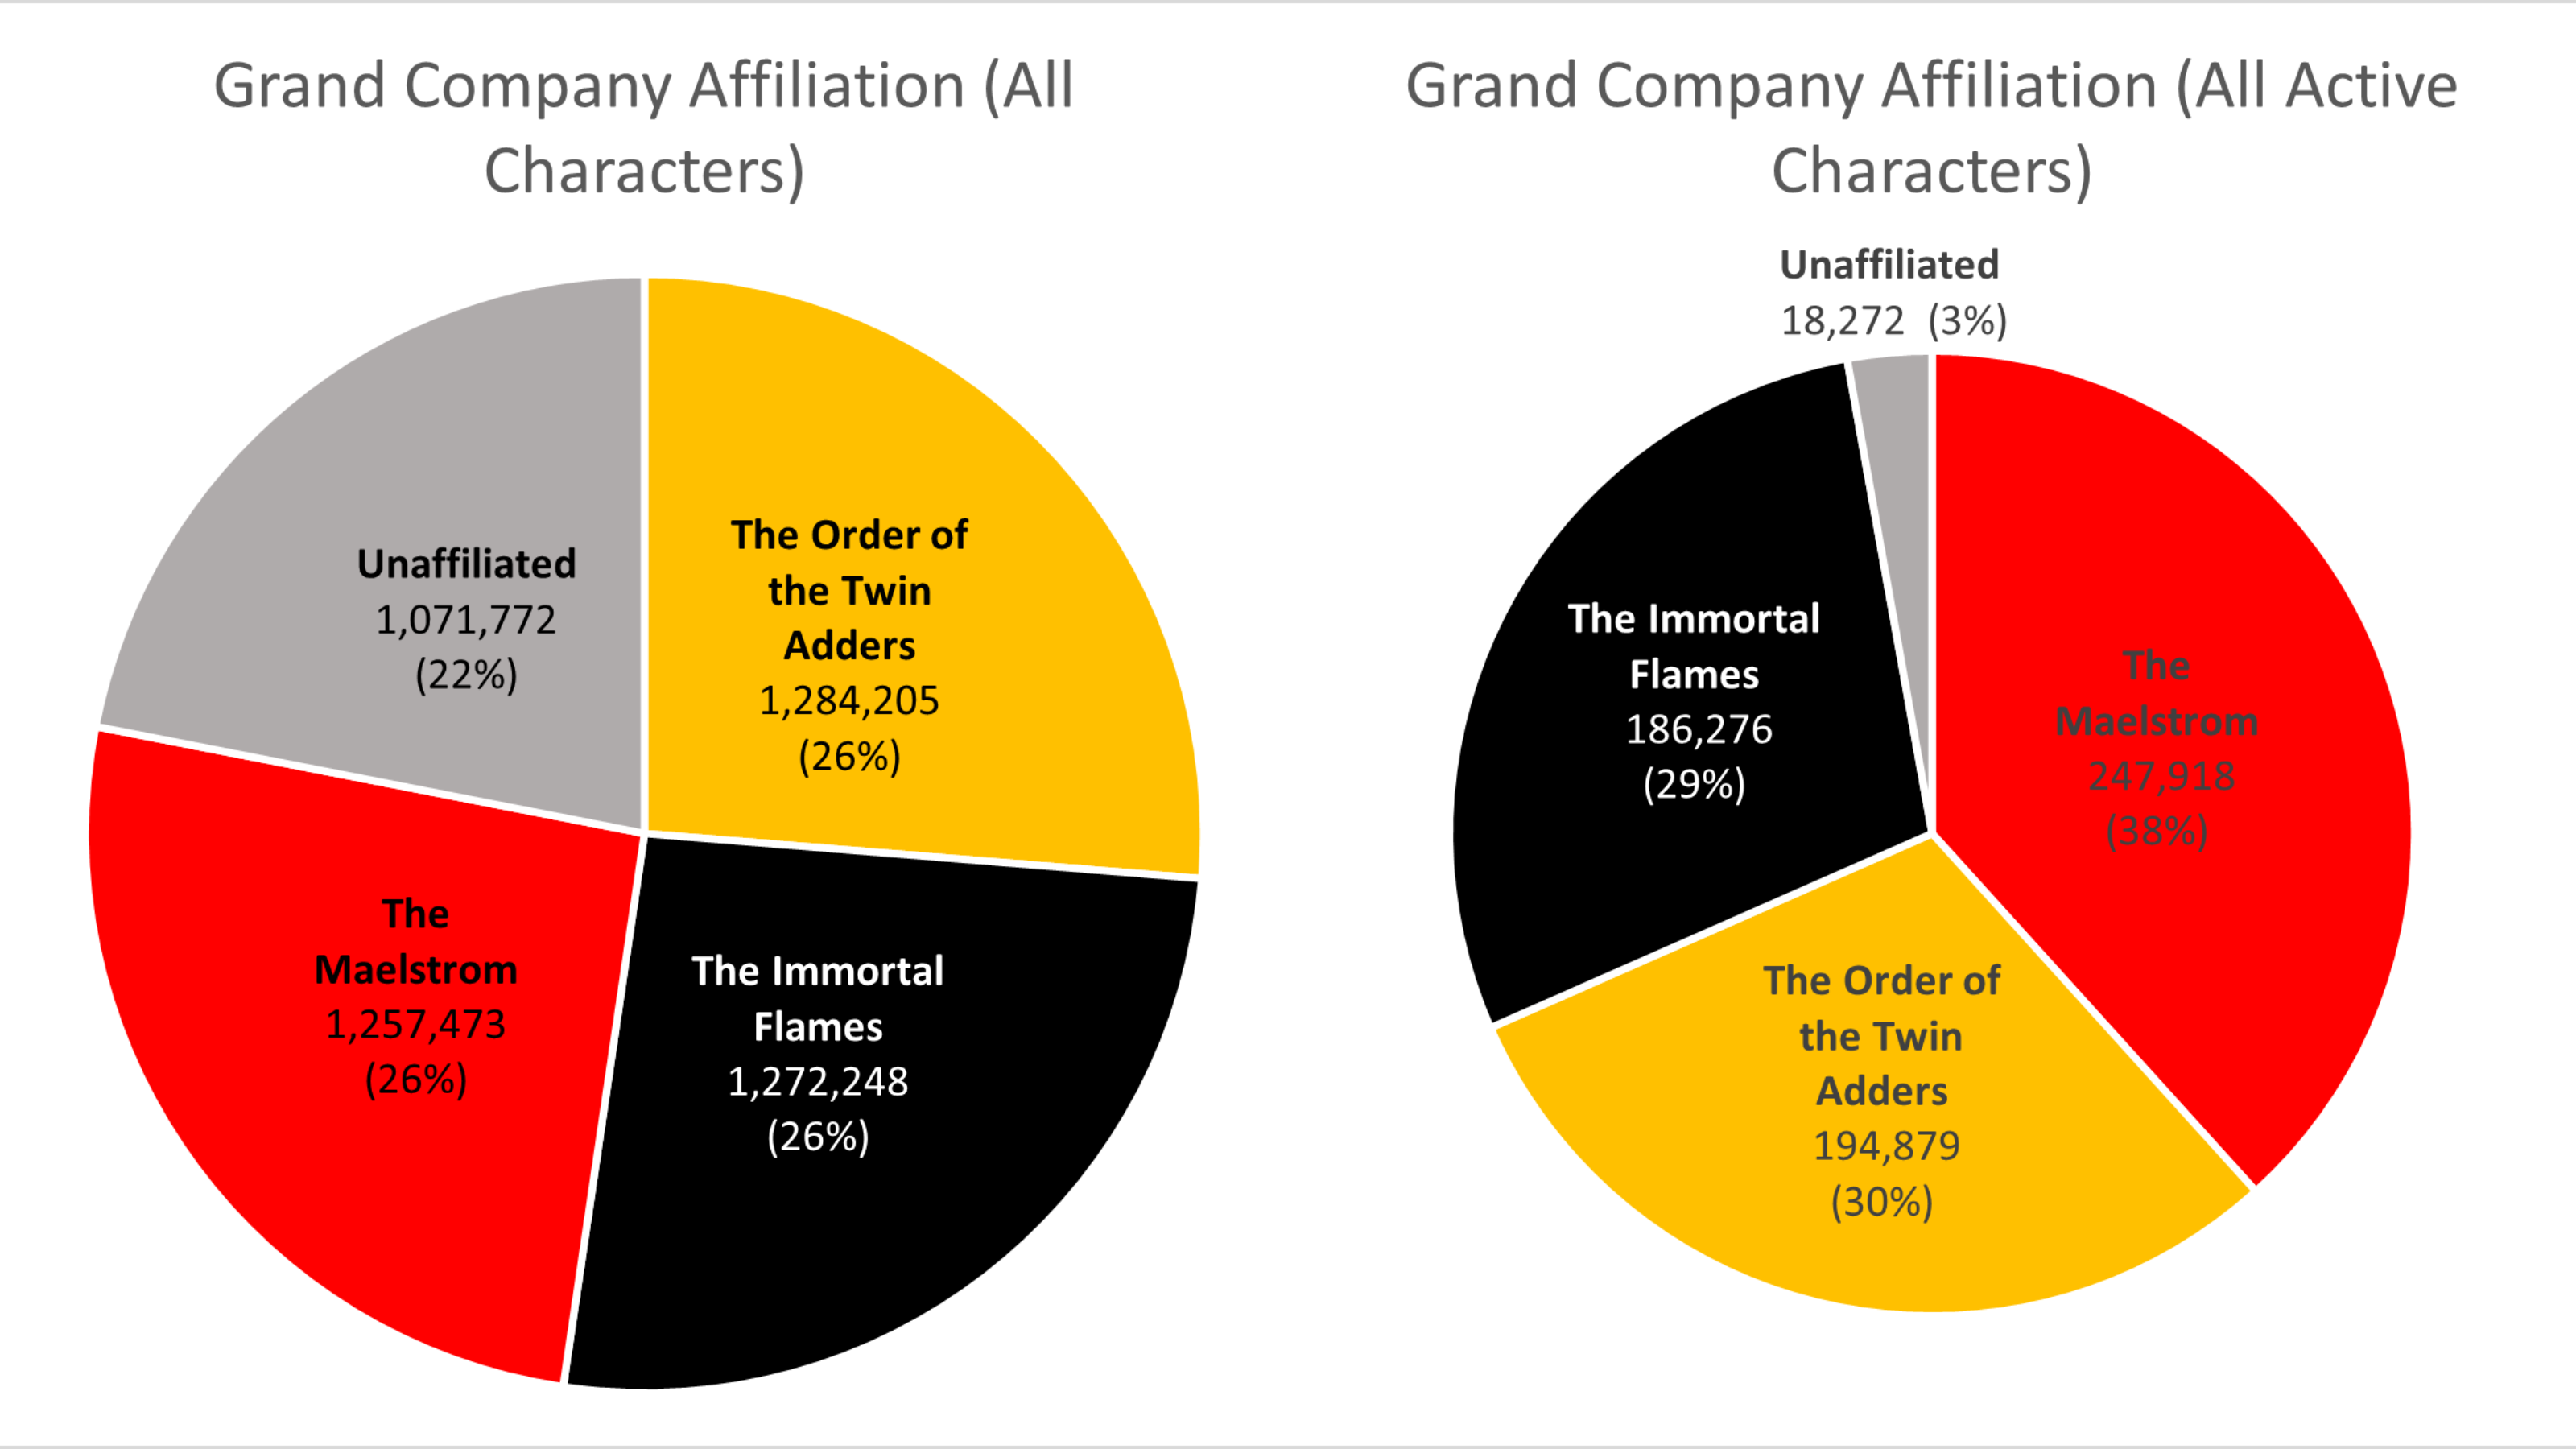
While looking for data that is better suited to a pie chart, I recall a census site created by a small group of Final Fantasy XIV Online players, XIV Census. Though the data shown on the site may not be up-to-date (only shows data collected as of April 2020), I did find a pie chart for Grand Company statistics. Hovering my mouse over each slice only shows the number of characters enlisted in each Grand Company, as well as players who have not progressed far enough into the game’s story to select a company. However, the information does not list the percentages, so I took it upon myself to properly graph the data.
Source: XIV Census

The chart on the left depicts Grand Company affiliation across all characters, while the chart on the right shows where all active characters are enlisted. Among all characters, the Company distribution seems fairly equal. Compared to the number of active players, however, it is evident that the Maelstrom and Order of the Twin Adder are the two most popular Grand Companies.
Categories
Uncategorized

Comparing Benchmarks

In business, benchmarking is used to measure a company’s success. If you can see a clear and present gap, you can figure out what to fix before things get out of hand. Companies can gain a competitive edge by studying their competitors and can have a fighting chance.

There are lots of different ways to represent a benchmark on a graph. Sometimes it’s as simple as making a line, other times you have to compare multiple things so one line won’t do.

How to add a line in Excel graph: average line, benchmark, etc.
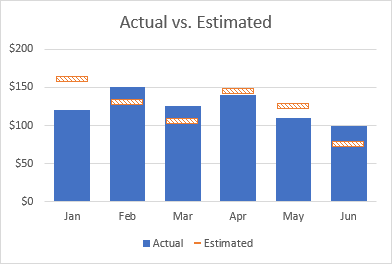
In this example, we have a combo chart. this explains the many benchmarks that were set each month.

A benchmark is essential a goal for a company to set. You reach that goal by just passing the line. In my first example, you can see in June, the company set the benchmark very low and were able to pass it.

ICMM • Benchmarking Safety Data: Progress of ICMM company members (2018)
In this graph, we’re now counting two variables (Fatalities and Total Accidents)

In this graph, the company us representing the frequency for all of their fatalities. This is a benchmark that you would want to see decreasing.

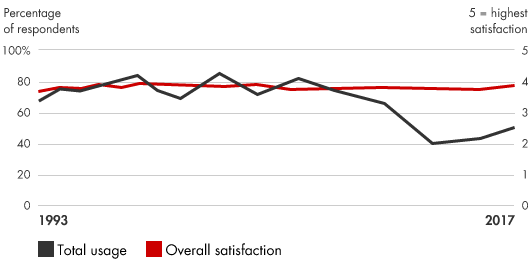
Management Tools - Benchmarking | Bain & Company

Companies can use this data to show how well their products are doing. While the overall satisfaction is remaining constant, the company has seen a dramatic decrease in the usage of their product. This can tell a company that they need to make a change in their production.

https://www.bain.com/insights/management-tools-benchmarking/

https://www.icmm.com/safety-data-2018

Categories
data visualizations Uncategorized

Comparing Numbers

Data is all around us, in different shapes and forms, and sometimes it is hard to decipher. Using visuals to compare data can make all the difference in comprehension, as long as itself is clear and concise. I found a video from Visme that gives a few pointers and explanations on how to improve Data Storytelling.

I felt it was important to share this video because comparing numbers is not just bar graphs and digits, it is a way to get information out to viewers. It is a type of storytelling that uses minimum words but insinuating on a focal point that helps the reader understand clearly.

Tools

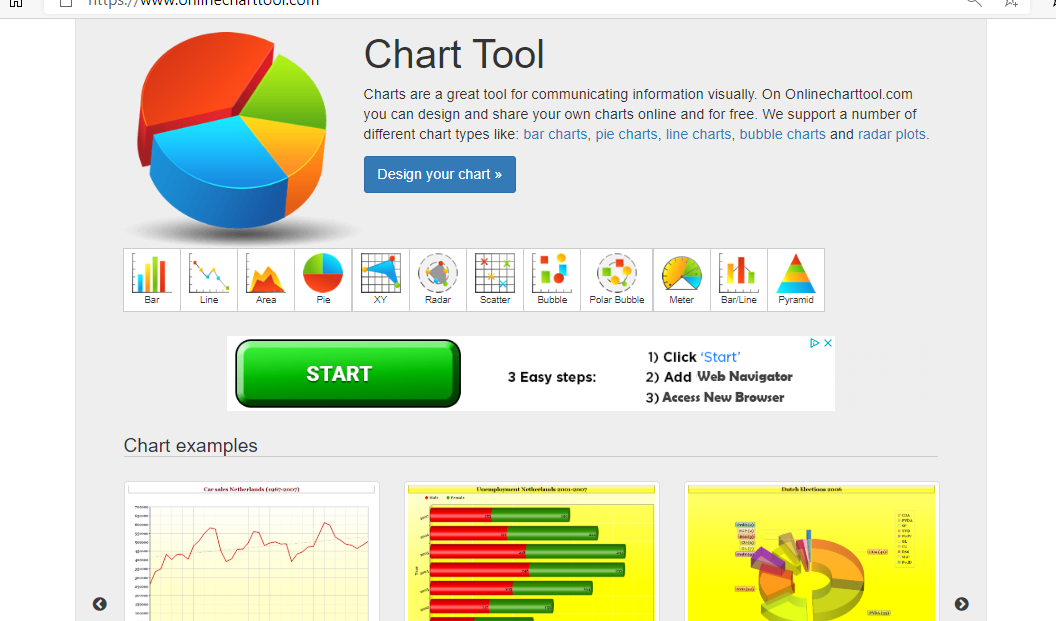
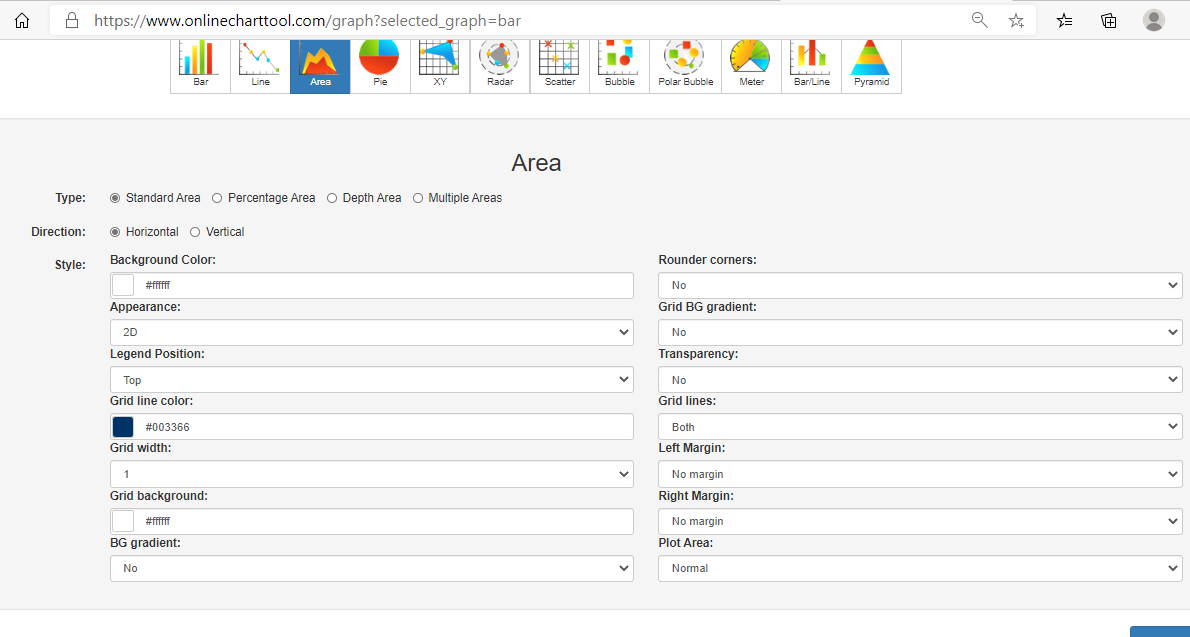
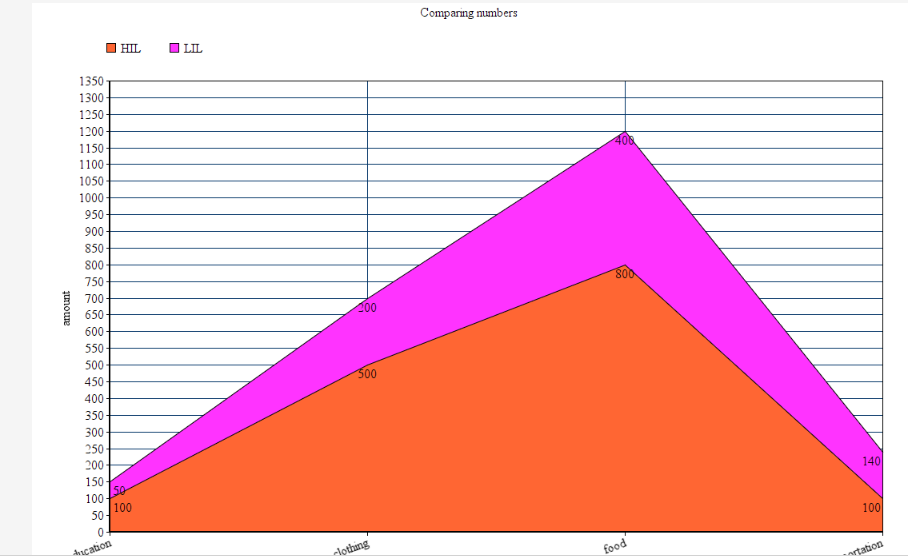
Online charts is a free website I found that is simple to use and can create a variety of charts and graphs in just a few minutes. It allows users to construct multiple types of charts and manipulate color, font, and data input.

Home page of Chart tools
Data input page
Finished Product

Users can download their graphs into different formats, such as, jpg. and pdf.

Covid-19 and Education

As I was looking through UNICEF’s website I noticed a separate link just for data and found some well-created infographics that are not only current and relevant but perfect examples of comparing numbers. Covid-19 has created devastation all over the globe and continues to do so today. Children around the world are feeling the impact due to the pandemic, not only home life but in their education. Below are a few infographics that I felt highlighted the five tips from the video above and accentuated their intended purpose while comparing numbers.

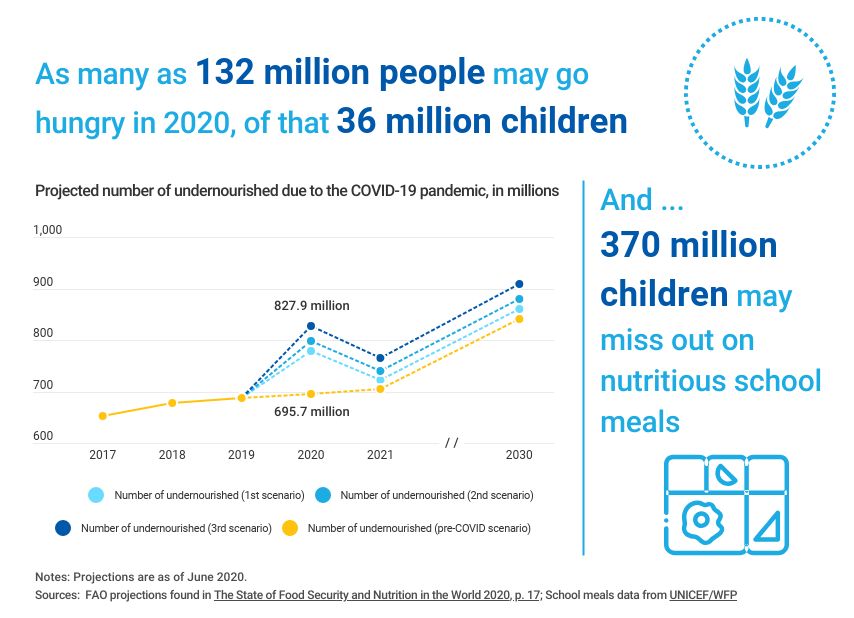
A well labeled graph comparing prior undernourished children to current and projected scenarios.

A representation of children affected by school closures due to Covid-19.
A projection graph comparing the possibility of economic decline due to the pandemic.

If you take a look at all three graphs you can easily read and understand the visualizations set forth. Each graph has a focal point which is portrayed using colors, patterns, and contrasting visuals. The graphs all are labeled properly with limited distraction, making them readable. All of these graphs read left to right following the rule of thumb of conventions, each comparison with a time line keeps the time line on the x-axis to avoid confusion. I think

Categories
Uncategorized

Data Visualizations Tools

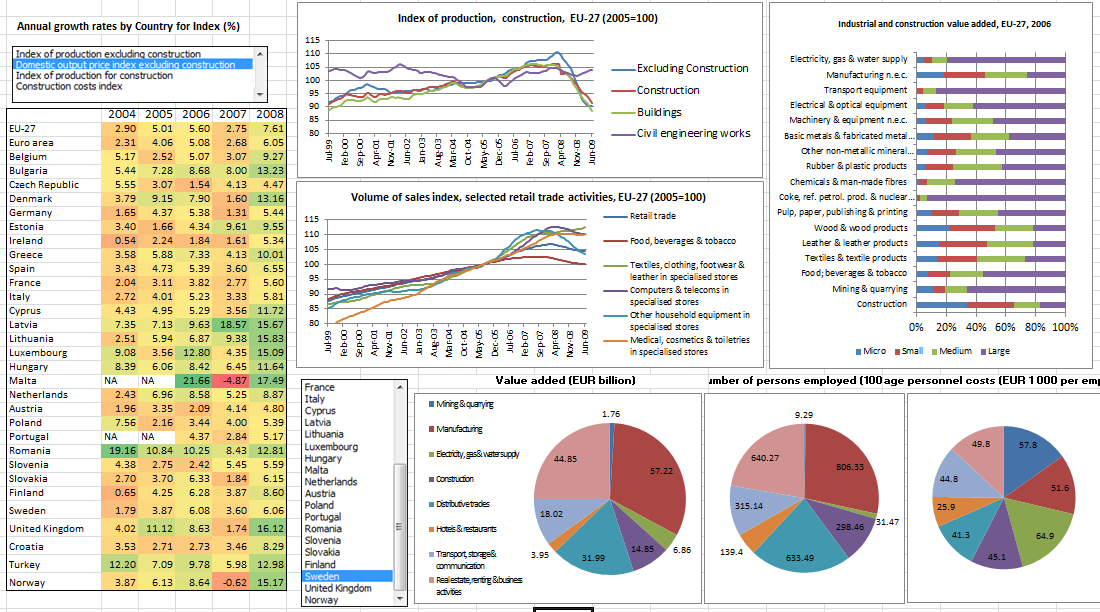
Excel is one of the most useful tools for creating Data Visualizations

Categories
data visualizations Visualization Tools

Visualizing Health

VizHealth is a collaborative project developed by the University of Michigan and the Robert Johnson Wood Foundation. This tool allows users to choose from 54 original data visualizations which have been tested through research amongst the general public. Utilizing The Wizard tool allows users to figure out what the primary goal for communicating the risk is and whether their audience needs to understand the basic idea or to remember exact risk numbers.

Figure 1. The Wizard tool from Visualizing Health.

Based on the answer to these two questions, the tool will display graphics that best match your needs. These images can then be modified to fit your own data. You can also browse through the gallery according to specific tags to find the most effective visualization for you. This is a great tool that can be used by anyone from students to professionals as these graphics have already been tested and proven effective to convey information to the general public. There is also an external link to an Icon Array Generator provided by the University of Michigan Risk Science Center that users can utilize to create their own custom images.   

Figure 2. Gallery of 54 graphics that can be downloaded from Visualizing Health. Results shown for raise or lower concern and gist understanding tags.
Figure 3. Racial disparities in rates of disease visualization from Visualizing Health. Users can choose to download the original image or view the PDF file detailing design specs, testing methods and results for that specific image.


Fig. 4 External link to Icon Array Generator from the University of Michigan Risk Science Center.