Here, I pulled information from the World Health Organization’s (WHO) daily COVID-19 database as of December 2, 2020.
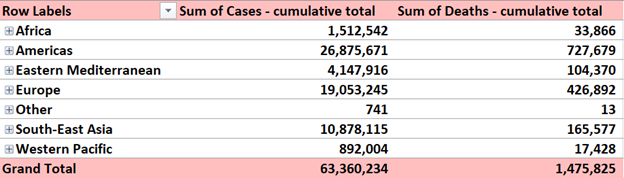
Here, I pulled information from the World Health Organization’s (WHO) daily COVID-19 database as of December 2, 2020.
What are Pivot Tables and why are they useful?
Pivot Tables are essentially reports that companies use for their own personal checks and balances. What sets them apart from statistical charts is the fact that they are very interactive. Instead of having a multitude of confusing formulas, you can have a very simple table where you can choose what variables you want to compare.
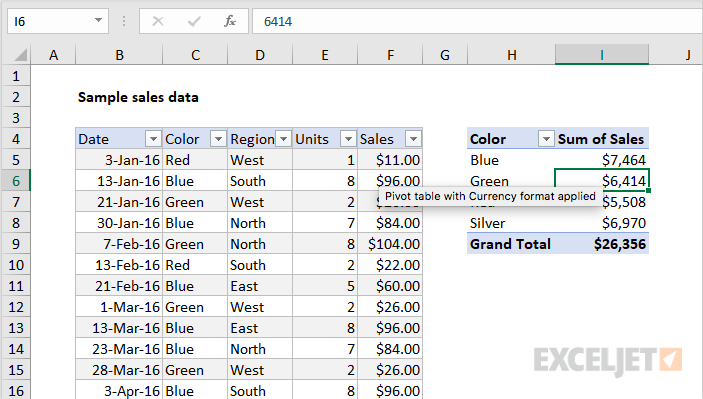
In my research, I found a lot of interesting ways to use Pivot Tables. This website was particularly helpful in simplifying what the tables are used for and how to construct one.
https://exceljet.net/excel-pivot-tables
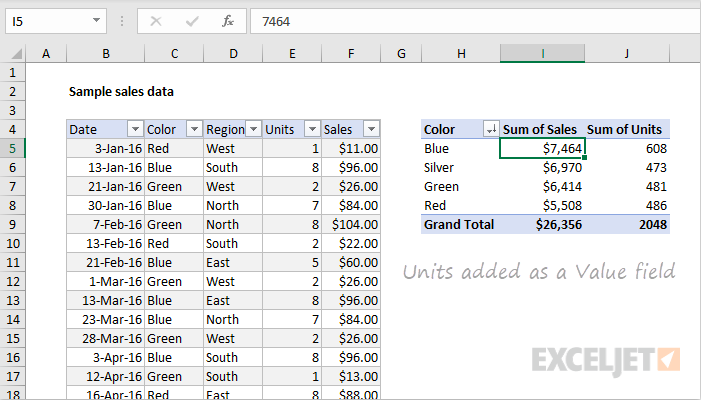
According to https://www.criticaltosuccess.com/top-29-pivot-table-tips-for-consultants/ , The best use for pivot tables are for recording sales numbers. You can specify the time of year, a certain product, and a lot of other fields.
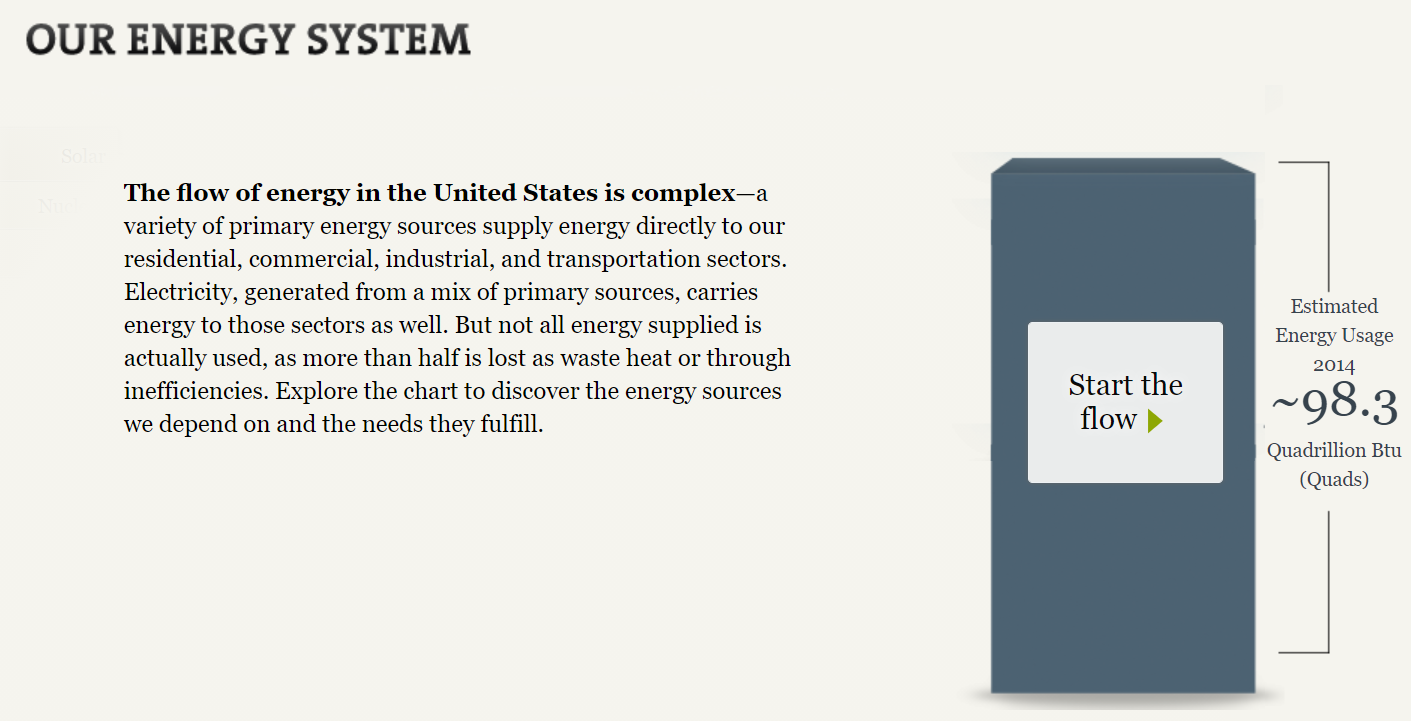
Energy consumption is a major issue in the United States that spans across multiple topics, from the oil industry’s environmental impact to the debate over alternative sources such as nuclear power and hydro dams. Yet, most Americans are largely unaware of how much energy gets consumed daily, focusing more on where the energy comes from.
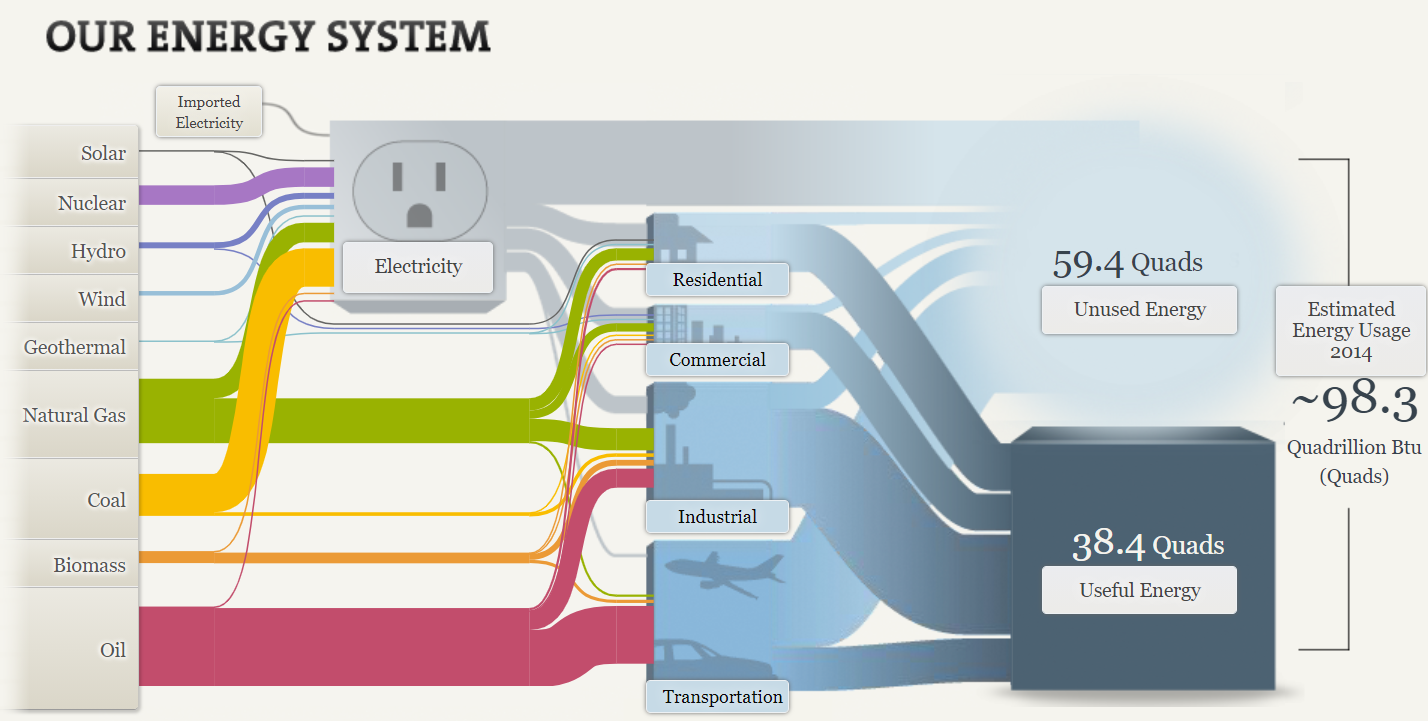
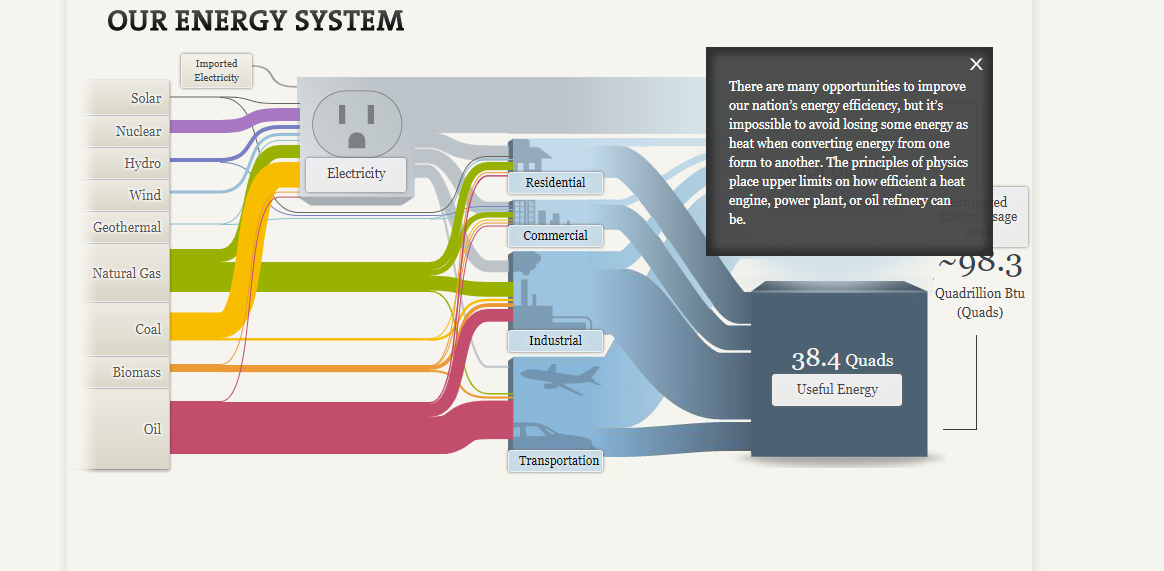
The National Academies of Science, Engineering, and Medicine compiled a Sankey chart depicting America’s energy usage in 2014. Much to my surprise, about 60 percent, or 59.4 quads, of generated energy went unused. Clicking on each point in the Sankey chart brings up a tooltip containing details about each source and how much energy gets used.
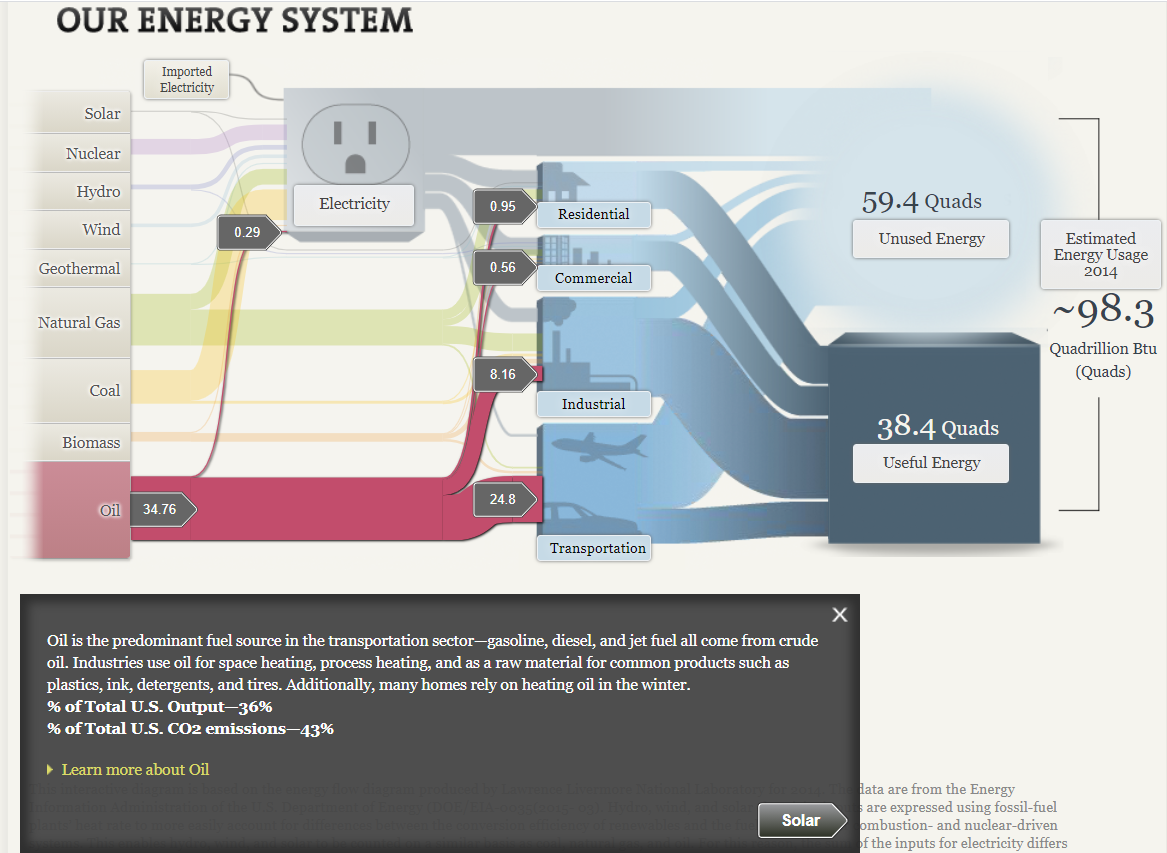
Unsurprisingly, petroleum products were the largest energy source in 2014, primarily used in industry and transportation. The second and third-largest energy sources were natural gas and coal, both of which were converted into electricity to power residential homes, commercial and industrial businesses.
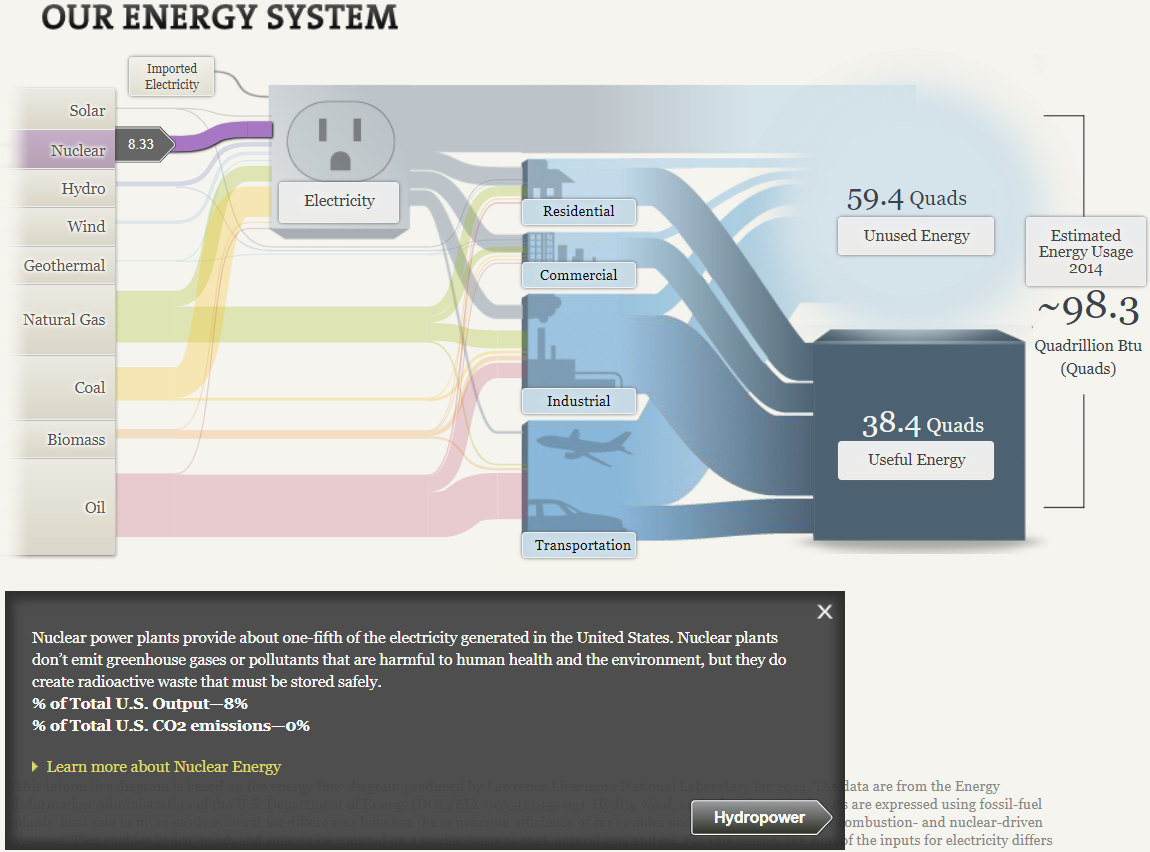
Nuclear energy is possibly the most controversial alternative energy source due to its implications in disaster events (Chernobyl in 1986, and Fukushima Daiichi in 2011) and the nuclear arms race. As the tooltip states, nuclear energy provided one-fifth of the nation’s electricity. While they don’t create any carbon emissions, radioactive waste from the power plants is still a health hazard. Additionally, opponents of nuclear power cite the potential for these power plants to be weaponized or targeted by terrorists if the health risks involved in handling radioactive materials aren’t enough to raise concern.
I really enjoyed this website. The interactivity alone was awesome, paired with the interesting data. The energy chart was really to navigate and understand.
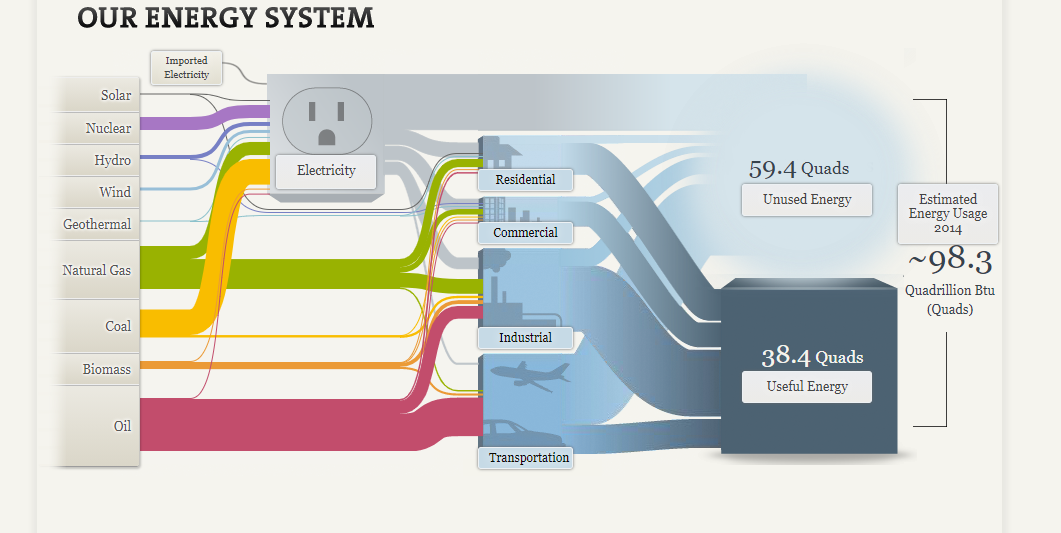
Each of the colors represented the forms of energy really well and puts a lot of our energy production into perspective. As you can see, Oil (In Red) is represented as the largest because it’s one of our main forms of producing energy for transportation.
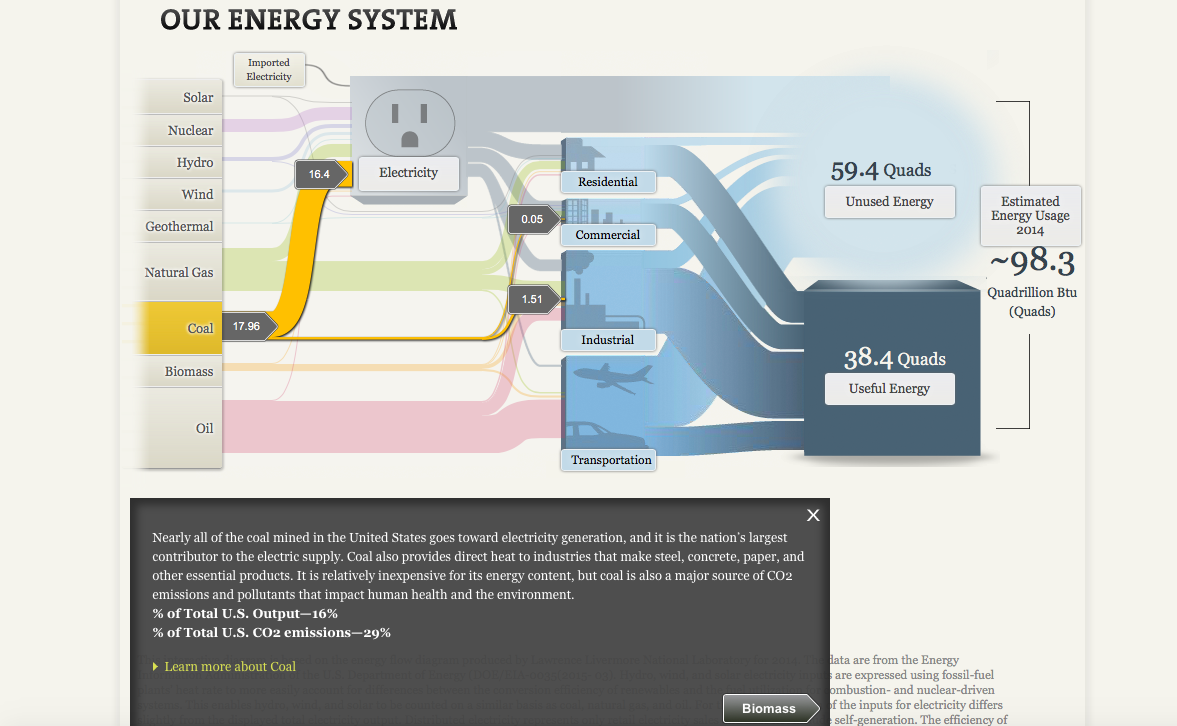
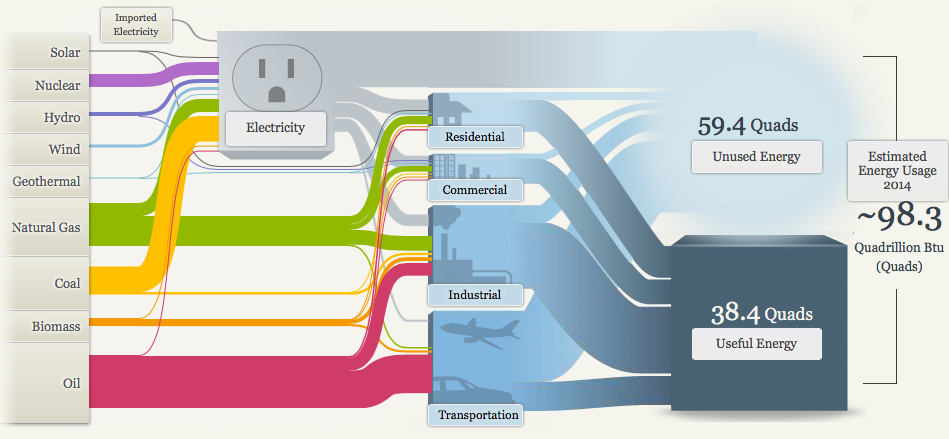
Clicking on each stream will give you facts about the energy you’re interested I researching and it will then conduct you to the next part in which this certain material is used in the energy making process. In this specific instance, coal is mainly used to produce electricity.
All of this adds up into useful energy which is measured to be about 38.4 Quads. If you would like to check out this chart for yourself, click the link here: http://needtoknow.nas.edu/energy/interactive/our-energy-system/
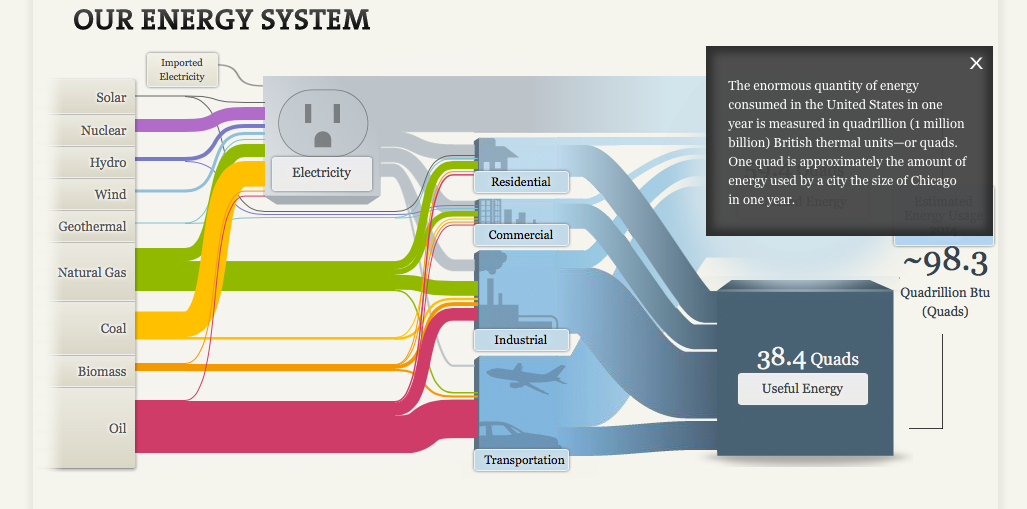
The National Academy of Sciences uses Sankey visualizations to explore our nation’s energy system. Although this type of visualization may be unfamiliar to many of us, Sankeys allow us to visualize flow when there are multiple inputs and outputs, which is why it is a perfect visualization to use when mapping out our nation’s complex energy system.
Based on the thickness of the various colored flow lines depicted in the picture above, you can easily see that oil, natural gas and coal are the nation’s leading sources of energy. The inputs (energy sources) then flow into various outputs (energy uses such as residential, commercial, industrial, transportation and electricity). We can see that the majority of oil is used for transportation purposes while coal is used for electricity. This visualization is also interactive. By clicking on some of the textboxes you can find more detailed explanations about that topic.
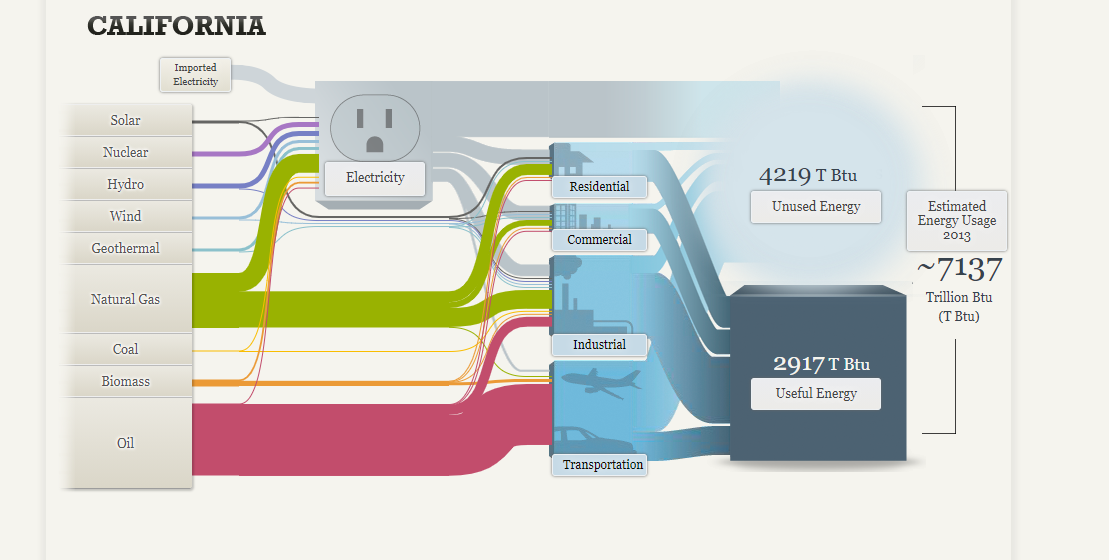
Separate visualizations are also provided for a regional energy system (MD, OH, PA and WV) as well as visualization for California state’s energy system.
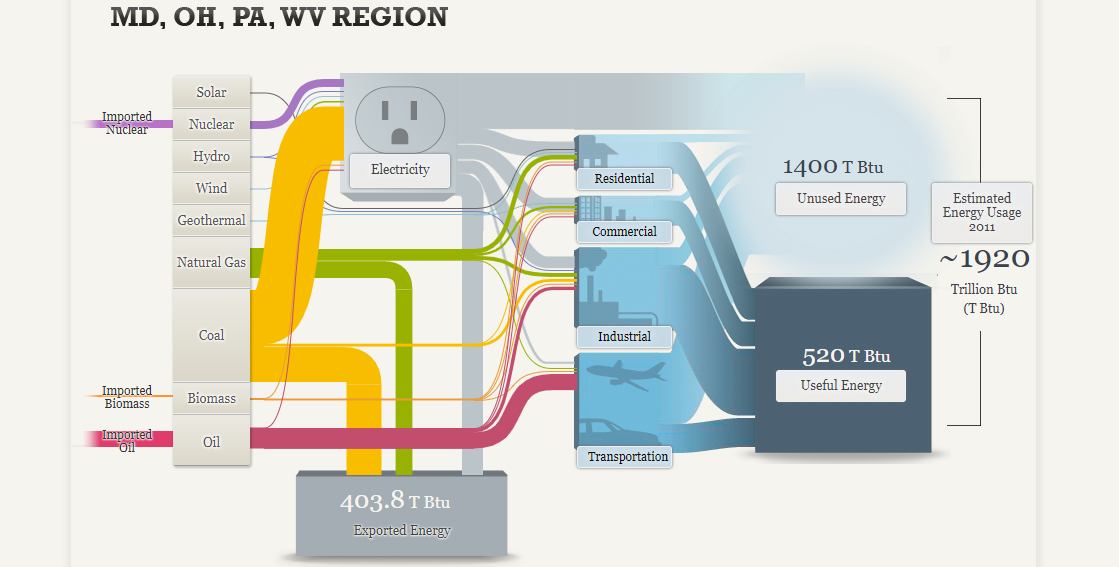
In conclusion, depicting the various energy systems in the United States through use of a Sankey visualization seems to be a great choice. Color coding the various inputs or energy sources allows the reader to quickly decipher which color belongs to which energy source. Since there is also a significant difference in oil, coal and natural gas usage compared to renewables such as solar, hydro, wind and geothermal, it was easy to recognize which sources contributed most towards our energy system and which contributed the least. Furthermore, the reader could easily see how each sector (residential, commercial, industrial, transportation) contributed to either useful or unused energy since these were depicted in starkly different colors.
Pie charts are useful for depicting parts of a whole in a dataset. However, most people think that pie charts are a one-size-fits-all solution for data visualization, often making a visual mess of the data or telling a misleading story about its message.
Recently, the Pew Research Center published a report about the value of online instruction in the wake of the ongoing COVID-19 pandemic. The majority of participants in one study covered in the report say that online instruction does not have the same value as in-person instruction.

Looking at the pie chart above from a design perspective, the researchers used a darker shade of teal to depict the majority opinion. In comparison, the lighter shade shows the minority opinion. The pie slice that is greyed out represents the 2% of survey participants who did not answer or had no opinion.
While looking for data that is better suited to a pie chart, I recall a census site created by a small group of Final Fantasy XIV Online players, XIV Census. Though the data shown on the site may not be up-to-date (only shows data collected as of April 2020), I did find a pie chart for Grand Company statistics. Hovering my mouse over each slice only shows the number of characters enlisted in each Grand Company, as well as players who have not progressed far enough into the game’s story to select a company. However, the information does not list the percentages, so I took it upon myself to properly graph the data.
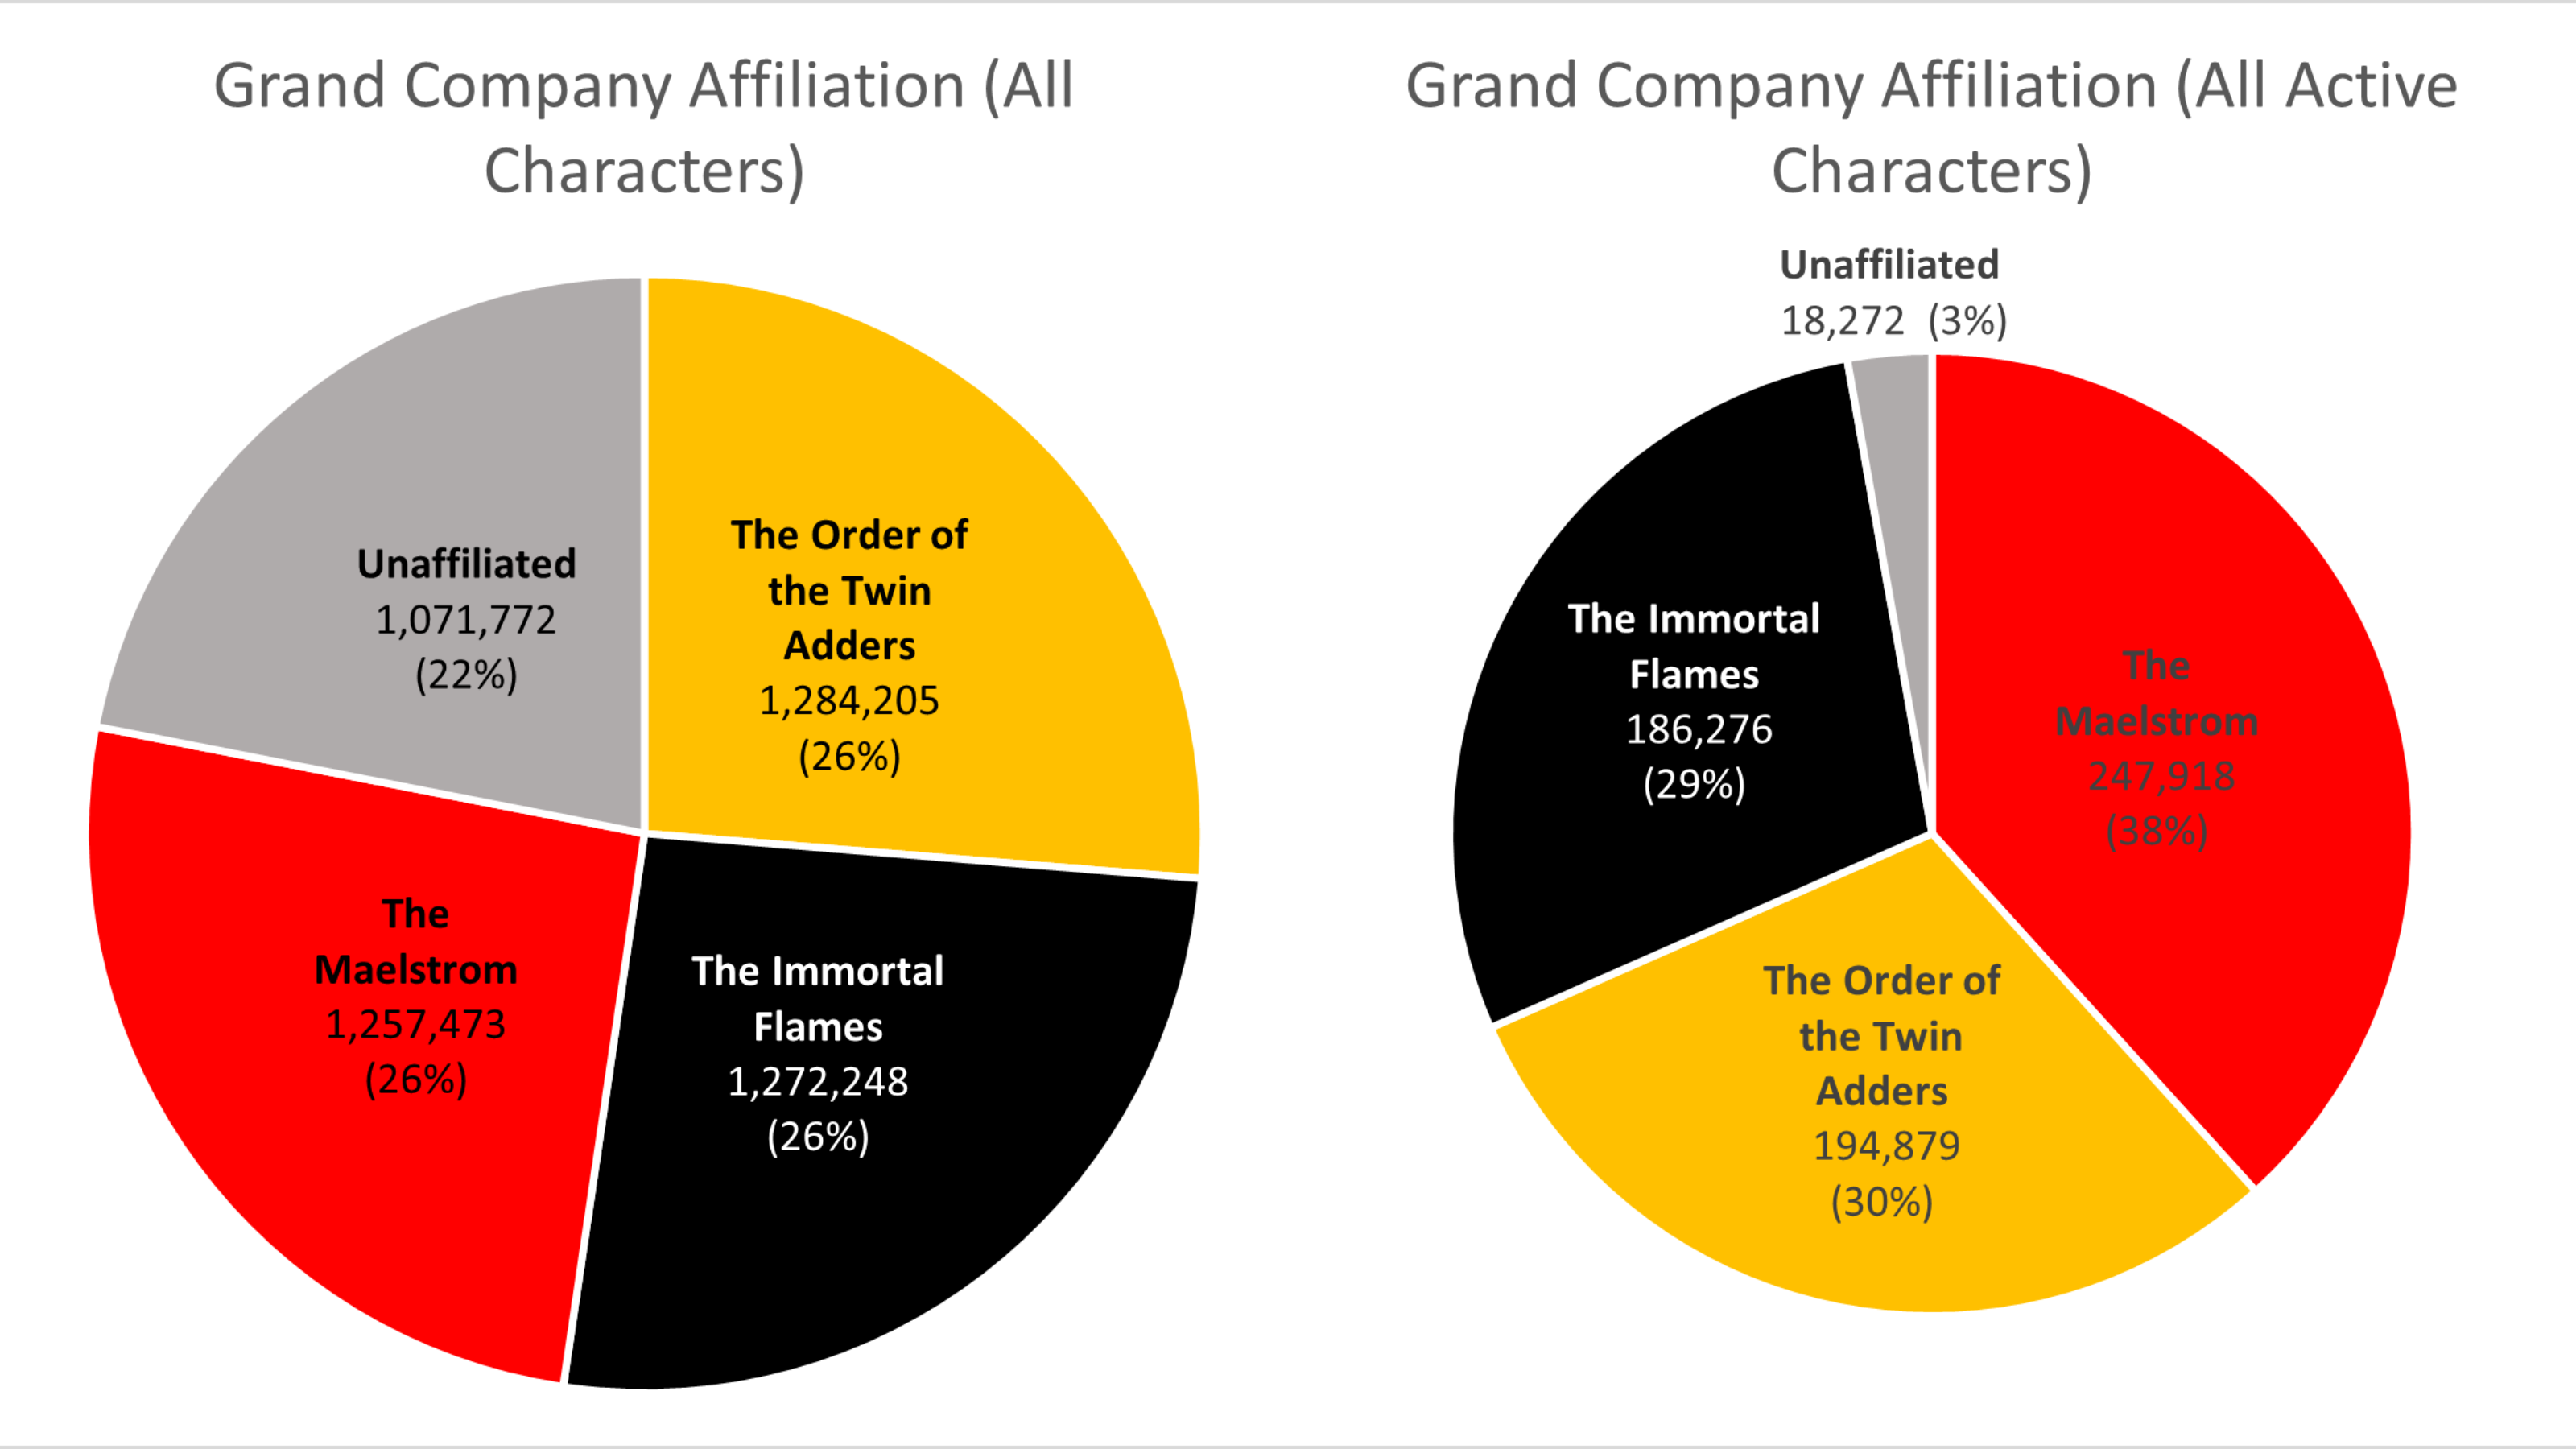
The chart on the left depicts Grand Company affiliation across all characters, while the chart on the right shows where all active characters are enlisted. Among all characters, the Company distribution seems fairly equal. Compared to the number of active players, however, it is evident that the Maelstrom and Order of the Twin Adder are the two most popular Grand Companies.
Pie charts are one of the easiest ways to represent your data. Some people seem to like using these charts and including them in their data stories. Others can’t stand them for a multitude of reasons.
I am a personal fan of pie charts when they are done correctly. In cases of 2 or 3 pieces of data, a pie chart can show you how each of their values differ in proportion to the size of their slice. But when you have 5 or more values, the chart can become crammed and you cannot accurately visualize the data.

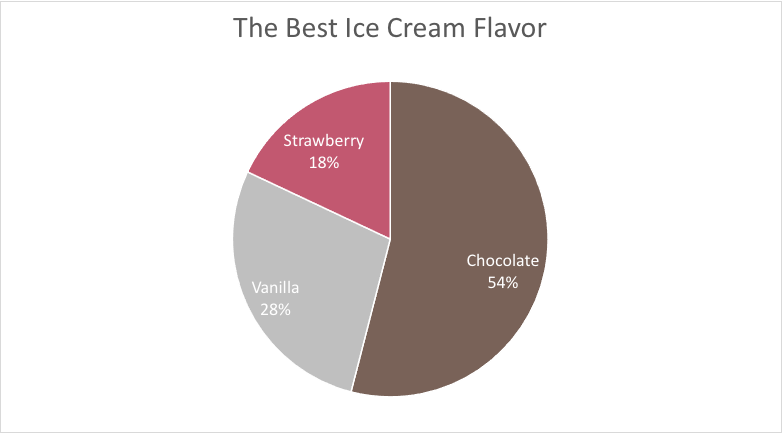
In this example, the values are easily identified and even have the values within their slices. This is a great way to show the significance of a number.

In this example, it’s a lot harder to see each of the data sets. Sure, the slices are labeled. But things are beginning to get cluttered and overwhelming. A simple bar chart would be much better to show these ratios.
More examples can be found at: https://medium.com/@KristinHenry/in-defense-of-pie-charts-and-why-you-shouldnt-use-them-df2e8ccb5f76
I wanted to include a pie chart of my own to show you what I think is the ideal chart.
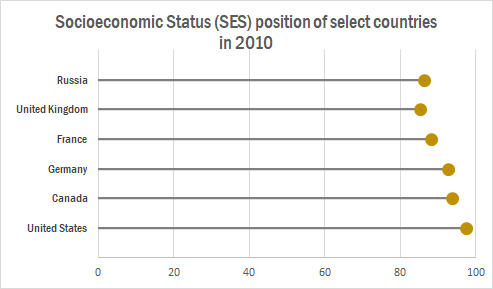
The lollipop chart is a variation of the traditional horizontal bar graph. It is used to rank categories, show trends over time or to compare categories. The lollipop chart eliminates most of the text show in a traditional horizontal bar graph, making it more approachable and minimalistic which allows readers to quickly gather information accurately.
The chart below shows a lollipop graph created in Excel. It displays the Socioeconomic Status rankings of 6 major countries in 2010. The graph has minimal information and therefore is easy to read. The reader can quickly learn that the United States has the highest SES ranking while the UK has the lowest.
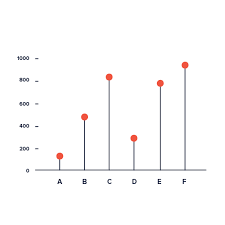
This type of chart can be used with any data that can be represented by a standard bar or column chart. It is especially useful when you have a large amount of categories to represent, making a bar graph too cluttered. Lollipop graphs can also be vertical like the one shown below taken from Visualbi. A vertical lollipop graph allows you to add labels inside the lollipop to easily highlight values. To learn more about lollipop graphs and how to create them click here.

I think Lollipop Graphs are really interesting and creative ways to show your data. The first interesting thing is that you can create them in one of two ways: Either through Scatter Plot Graphs or through Bar Charts.
Lollipop Graphs are very simple, yet they show you exactly what you need. and that’s their exact purpose.
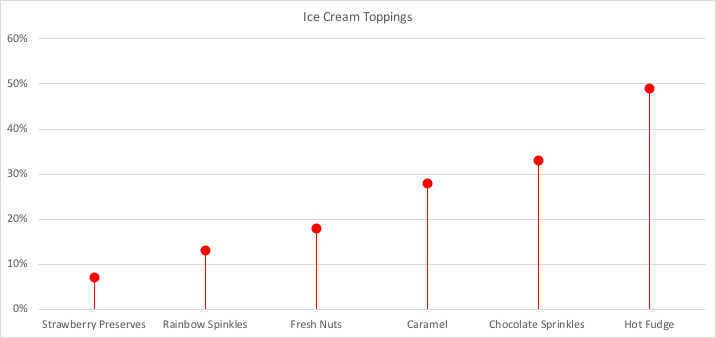
In my Lollipop Graph, I chose a data set about popular ice cream toppings. I chose to show them in ascending order because I thought it looked a lot better. It is very minimalistic, but I believe it gets the point across.
While doing some more research, I found some more variation of Lollipop charts like the ‘Cleveland Dot Plot’, which has a shorter line and shows two subgroups. More of these examples can be found at https://www.data-to-viz.com/graph/lollipop.html.
It is no secret that a majority of the United States thinks poorly of President Donald Trump, especially given his handling of the ongoing COVID-19 pandemic among other issues. But what do the nation’s overseas allies think of him? A Pew Research report published on September 15, 2020 details how the United States’ image waned on the global stage since Trump took office, and the numbers are damning.
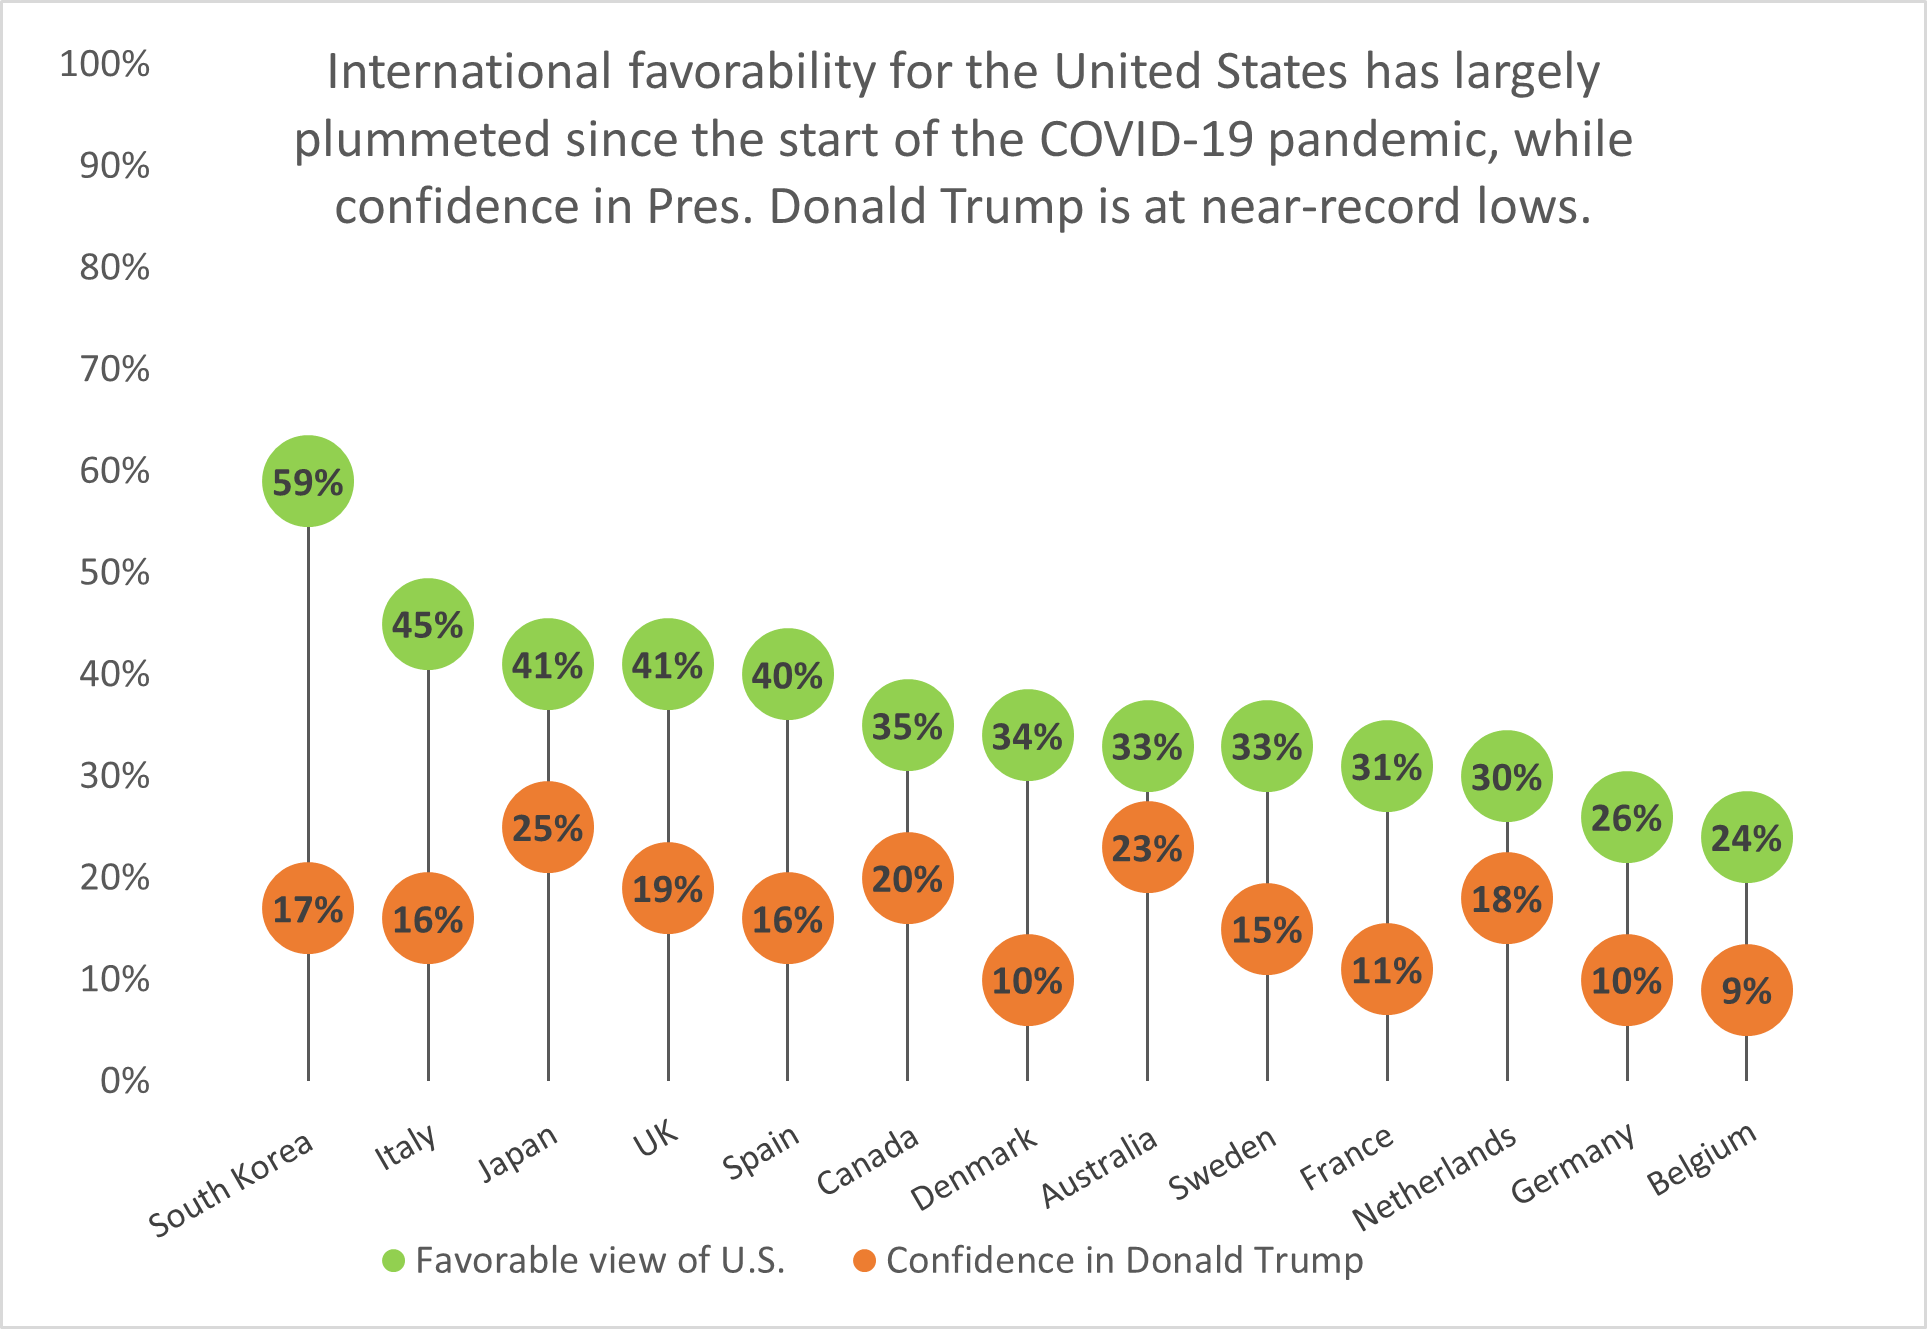
South Korea has the highest approval rating of the United States’ image out of thirteen nations surveyed, yet it holds little confidence in President Trump’s ability to lead the U.S. Fourteen points behind South Korea is Italy with a 45% approval rating, while Belgium holds the least favorable view of the United States and the lowest confidence in Trump.
Lollipop charts like this one are a visually-appealing alternative to column or bar charts because they cut down on the amount of space the chart ink takes up; instead, they focus on the data points themselves and showing how they rank among other categories.