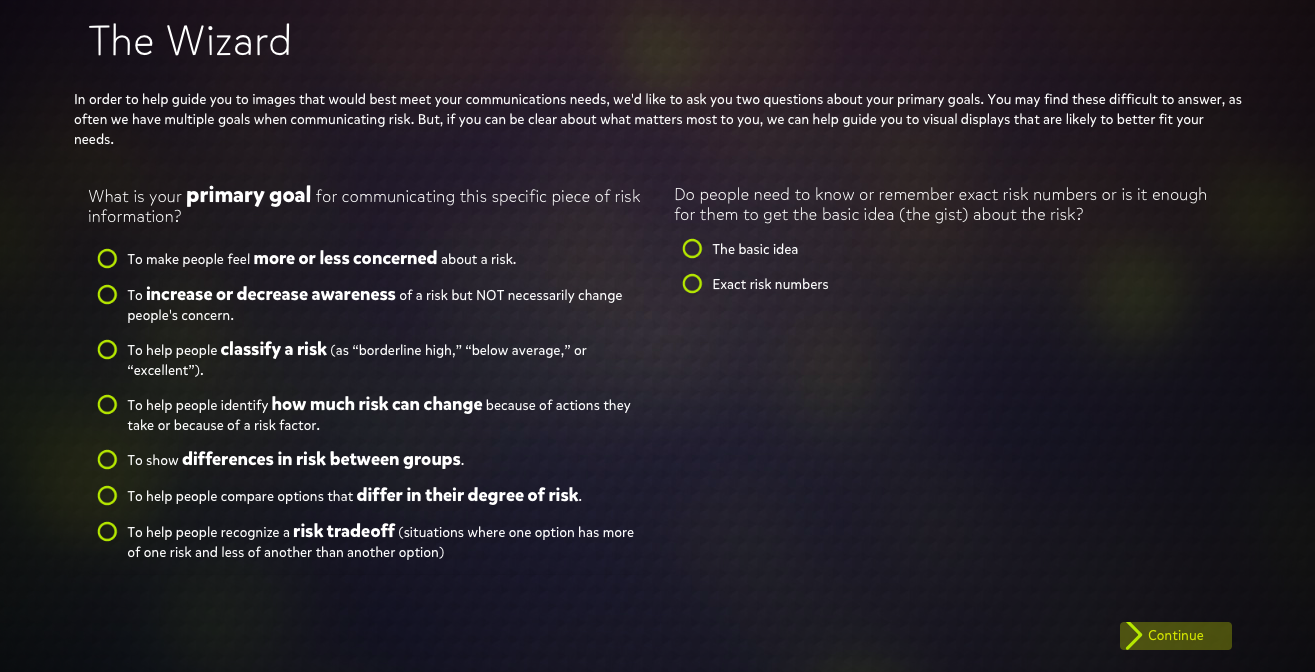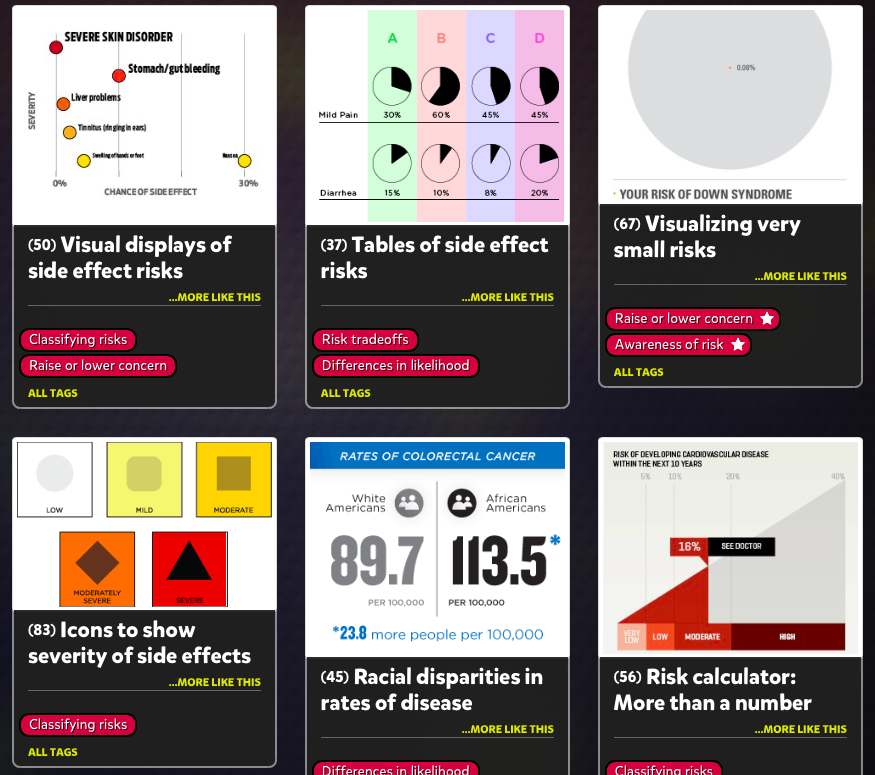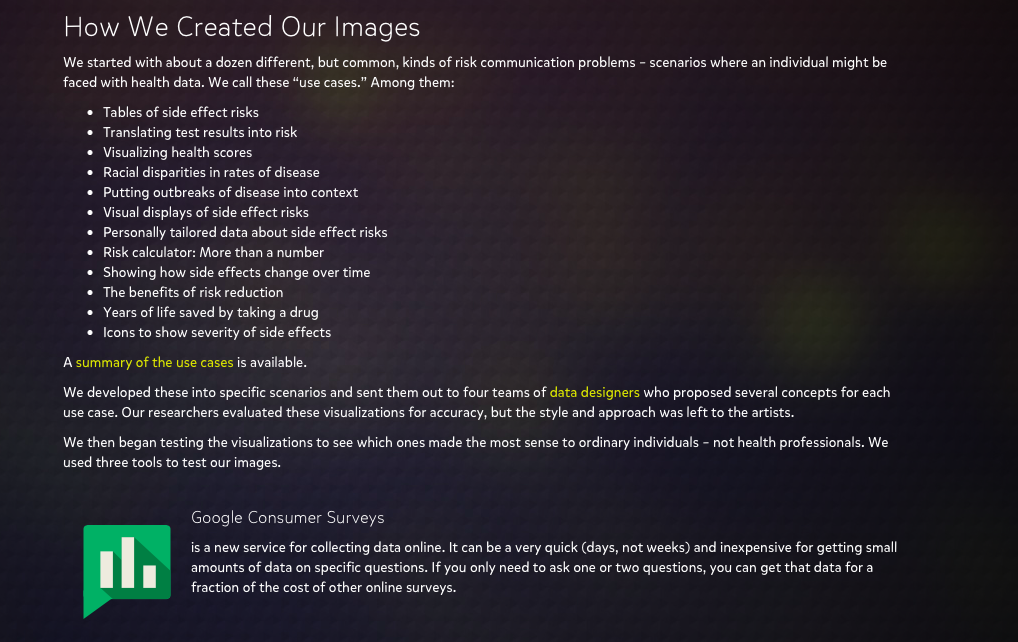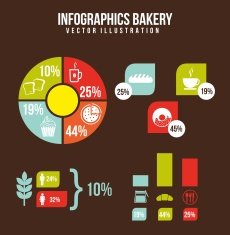
WHAT IS AN INFOGRAPHIC?
Infographics are an amazing way of being able to visualize and communicate information to people in a couple of fun images and visuals. They are great marketing tools and they will take the attention of your audience much quicker than a simple power point. With an infographic comes pictures, graphs, data-based visualizations and a very minimal amount of text that sums up the point you are trying to get across. It is also very important to know and to be as clear as possible so that your audience can understand what you are trying to show them.
KNOW YOUR AUDIENCE
Always know who your audience is! It is important to make sure that you are able to communicate clearly and find ways to connect with them through the information given in your infographic.
SHOW MORE, TELL LESS
I think that it is best to show your audience your information instead of telling them. In other words, put in a data-based visual like a graph or a pie chart and show them how the numbers corelate with your given topic. Amy Balliet suggested in Smashing magazine, “Every once in a while, turn off the text layer and see whether the infographic still makes sense. If there isn’t any data viz, or if a bunch of pictures are missing context, then you are doing too much telling and not enough showing.” If you are able to remove a piece of text from your infographic, and your visuals make sense on their own you are on the path of having an effective end product.
THE PRESENTATION OF YOUR INFOGRAPHIC
From viewing many different kinds of infographics most of them are created vertically rather than horizontally. With that downward-like layout, you should have clear transitions. Having good transitions both on your infographic as well as when you are presenting gives your audience a brief moment to let them know that you are going on to something else. Good transitions in your presentations also help your audience see the connection and relationship between one idea to the next.
Reference: https://www.smashingmagazine.com/2011/10/the-dos-and-donts-of-infographic-design/
