The Excel tutoring site EXCELJET describes pivot tables as, “one of the most powerful and useful features in Excel”. These interactive tables allow users to breakdown large data sheets into more manageable pieces that can focus on specific areas of the data. EXCELJET offers a quick and easy tutorial that breaks down each step needed to create an amazing pivot table.
My Personal Experiences
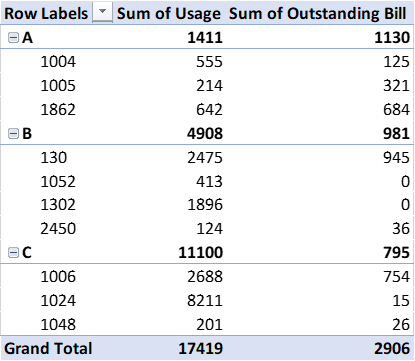
I was lucky enough to have used pivot tables before as part of an internship with a utilities company. They tables were a huge help when we needed to categorize and sort through large amounts of customer data.
The table above is just a small sample of the type of data we would have to work with and they would often include thousands of customers. Pivot Tables allowed us to quickly organize this data into whatever form we needed. Whether that was….
by the type of services they used,
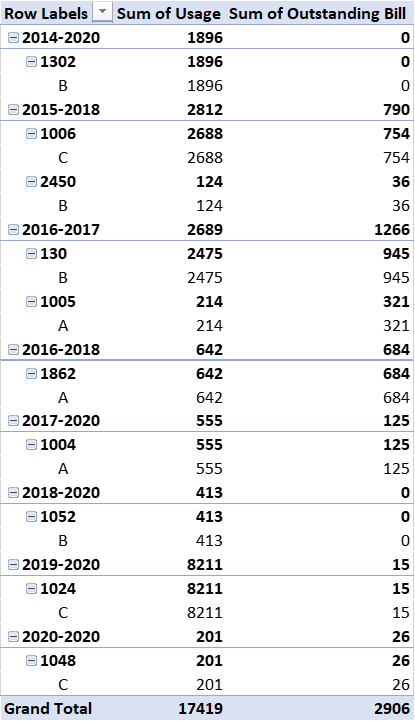
the length of the time that they were customers,
or to quickly find certain accounts for auditing purposes.
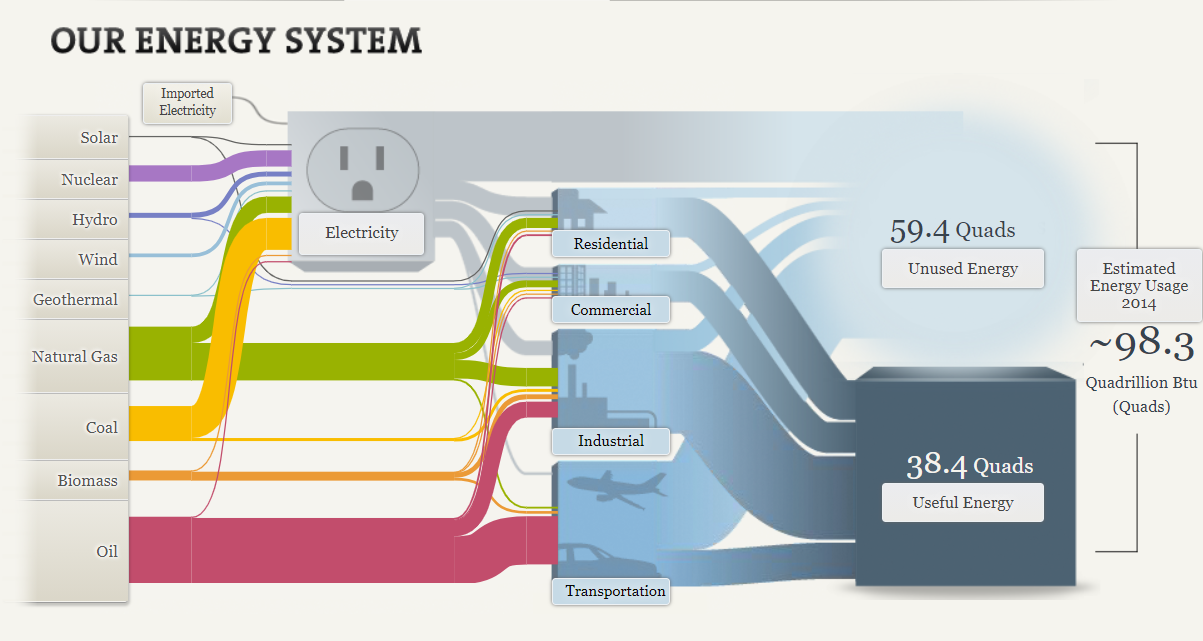
This week I had the pleasure of looking into the inner workings of the US energy system through the National Academies of Science, Engineering, and Medicine. Their approach to visualizing US energy production through the use of a SANKEY graph, pictured below, was very unique but fitting at the same time.
The beginning phase of the graphic already does a lot to convey the basic functions of the energy grid and the its various aspects. The flow from source to energy use is very natural and lends itself well to establishing the fact that the generated energy has to be moved through various stages before reaching its intended destination. When combined with the useful and unused energy figures, it establishes that there is some inefficiency in our current electrical grid that will lead to energy losses during transmission and that our current generation sources are not as efficient as we might believe.
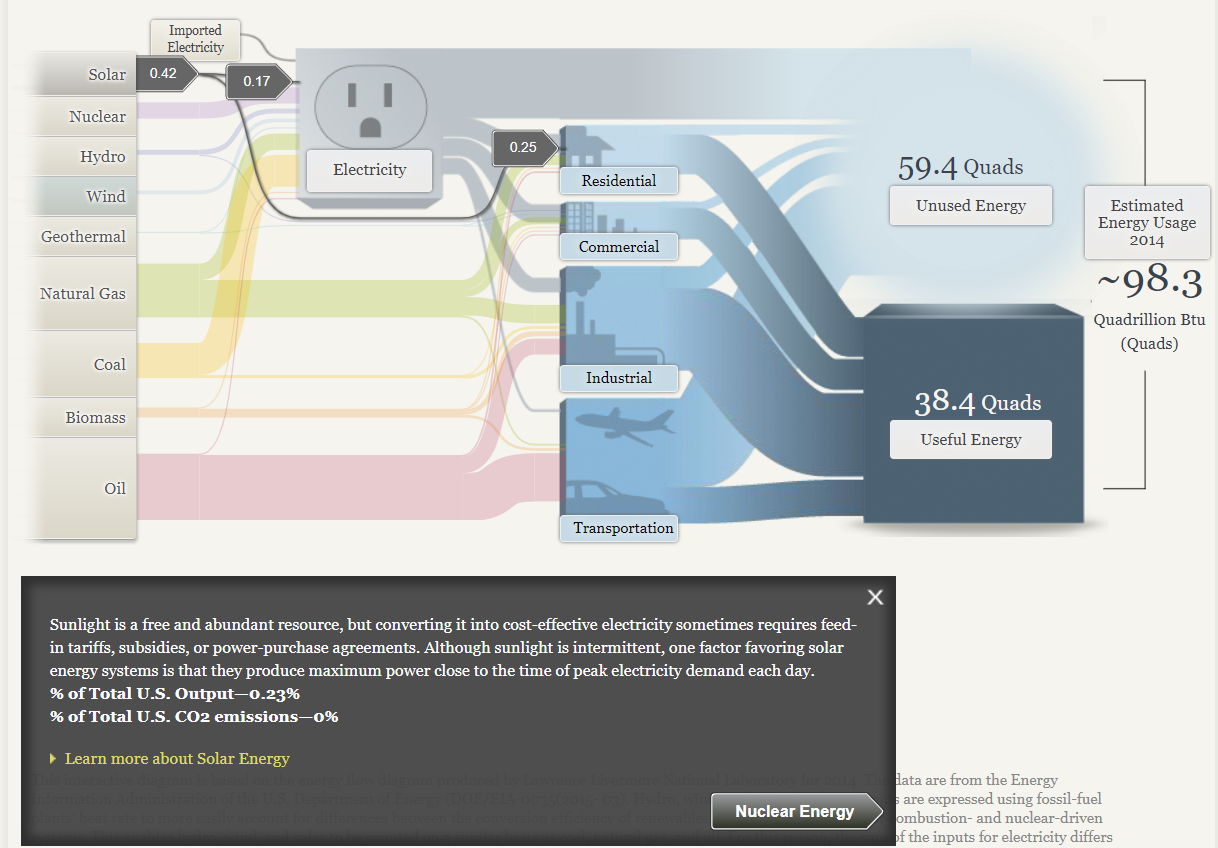
The option to expand the tabs on the left to access more information is useful as well. It helps keep the main space of the graph from becoming too cluttered with information. The breakdown of where the energy goes in terms of electricity and other uses is cool too, as it helps show off the fact that not all energy produced in the US is directly used for electricity generation. Some may be used for industrial process or for other applications like heating for homes an businesses in the case of oil and natural gas.
Overall I found the SANKEY graphic very fitting for this kind of information, but I can see it having very limited usefulness anywhere else. It seems like it would only be a good fit at describing processes that flow naturally from one step to the next.
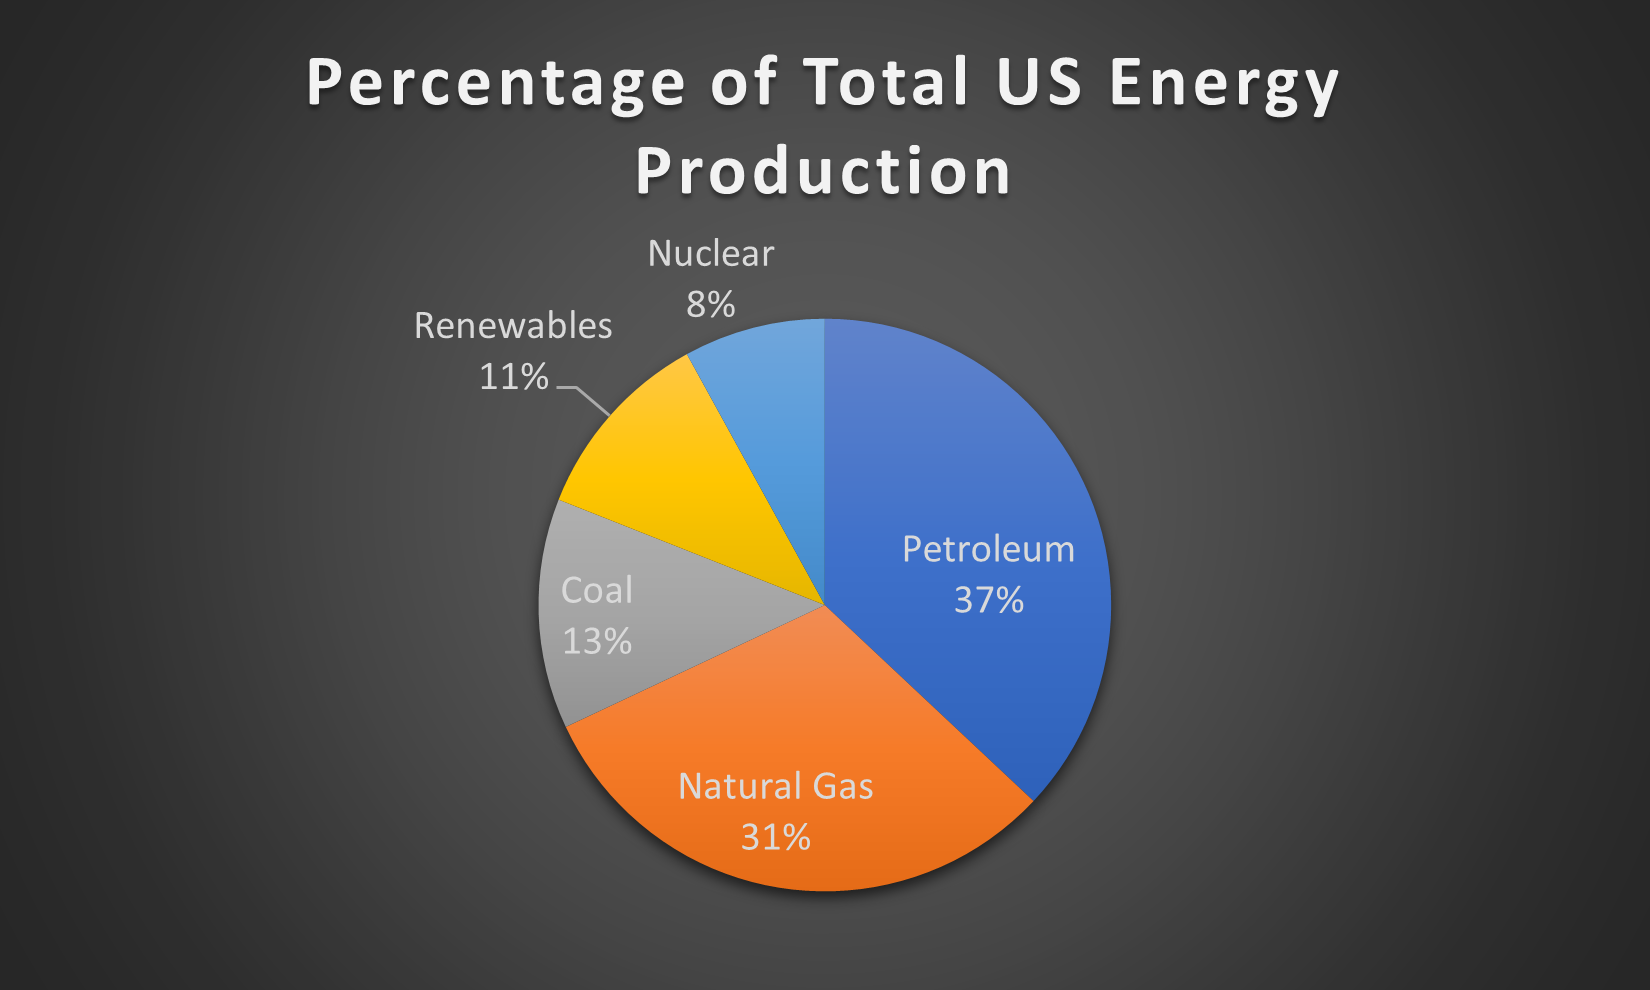
Pie charts are very simplistic charts that can neatly display data that describes various parts of a whole. A properly designed pie chart should….
Always add up to 100%
Display its slices in an easily understandable manner, such as by ordering them greatest to least in the clockwise direction.
Avoid displaying too many categories, as it can crowd the graph.
Never include any 3-D features, a simple 2-D pie chart is more than capable of getting its information across without the added visual noise of 3-D effects.
Ideally include a readable legend within the graph itself that also includes the percentages/figures from the data.
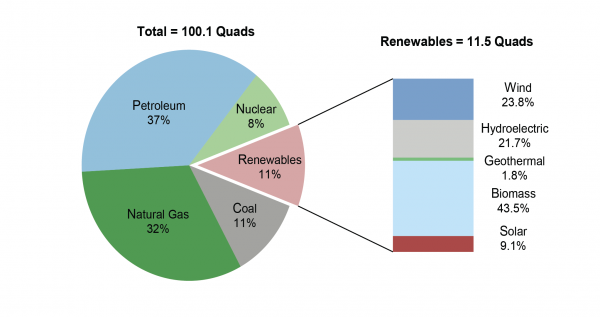
In order to display what a proper pie chart should look like, I used data from the Energy Information Administration on the make up of US energy production in 2018 by source.
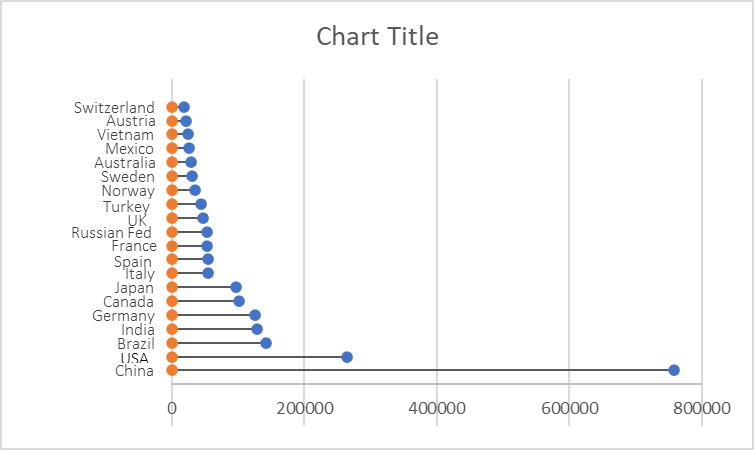
Lollipop charts are alternatives to traditional bar graphs that present their data in more visually appealing ways. They are best used when the differences between the data you are trying to present is quite large. When using a standard bar graph, this can make the chart look very cluttered and impeded the viewers ability to quickly discern what the chart is trying to say. The lollipop chart gets around this issue by forgoing the use of wide bars and instead using small columns ending dots, similar to a lollipop, to show the end point of the data. Ben Neville, a blogger at the data visualization site Tableau.com, has a post that looks much deeper into the topic than I do here.
My Lollipop Chart
As you all are probably aware of by now, I am very interested in renewable energy, so I have decided to look into the renewable energy capacity of the top 20 producing countries. This data can be found on the International Renewable Energy Agency’s website. I created mine by following the steps outlined in the “Effective Data Visualization” textbook.
Over this past summer, I was given the chance to upgrade my current laptop to a newer model. This presented me with the problem of deciding what kind of laptop I should buy and what parts I should be looking for. During my search, benchmarking infographics became the most important tool for finding the best deal for my needs.
PC Benchmarkers
There are a variety of freewebsites that allow you to test combination of PC parts to determine if they fit your needs. Each of these sites presents their results in the form of graphics relating their results to a general benchmark.
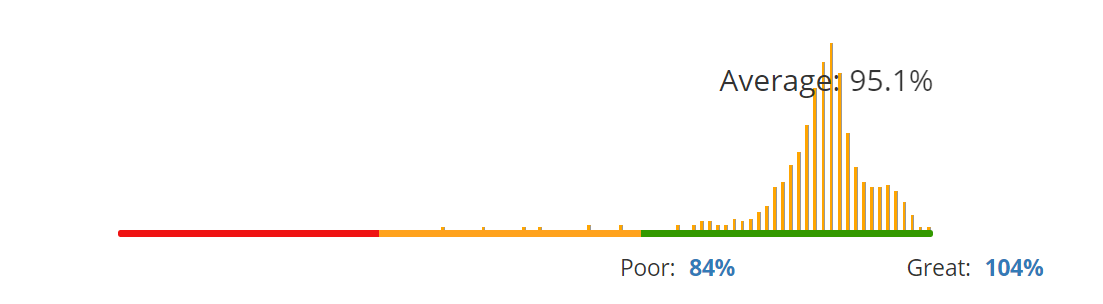
When evaluating the performance of a specific GPU, as pictured above, the results are presented based on their percentile position in comparison to other models. In this case, the percentile line serves as the benchmark that allows the observe to visualize how well the product they are looking at stack up to others.
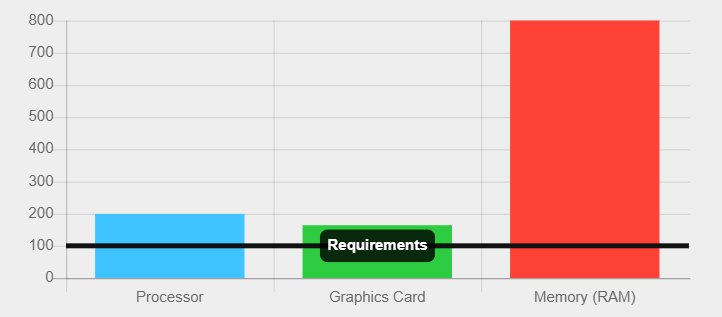
In addition to using the benchmark as an axis, other benchmarking infographics present their benchmarks as a more traditional minimum border. In the graphic above, the minimum requirements of a specific piece of software are presented as the benchmark. This border line allows the person viewing the graphic to see how well the parts of their PC are suited to the programs they wish to use.
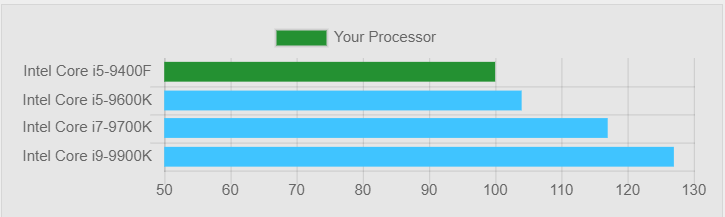
It is also possible to turn the information you are studying as a benchmark itself, such as with this graphic. By doing this, you could compare other options and visually see which ones could be improvements.
Given my background in Sustainability, I chose to explore the trends of energy production and consumption in the United States. Energy in the United States is an interesting topic as, due to its sheer size and geographic diversity, the United States has the potential to utilize a wide variety of renewable energy sources. Information regarding the production and consumption of energy in the US has been cataloged by the Energy Information Administration (EIA) ever since it was founded in 1974. In addition to providing the raw data, the EIA also publishes a wide variety of reports and infographics that can serve as excellent resources when designing your own graphics. Despite the EIA’s usefulness, I found that University of Michigan has put together a fact sheet that can serve as a much better introduction to the topic for those who are not already familiar with the Energy field. It is this fact sheet that I will be highlighting and discussing in the following sections of this post.
Michigan Fact Sheet
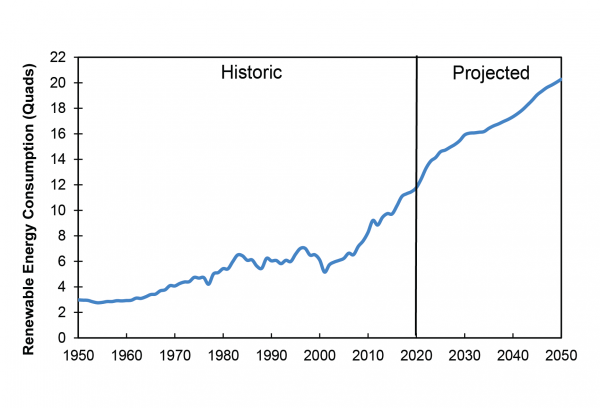
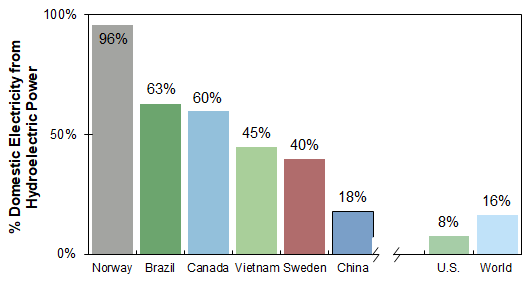
Drawing from the EIA’s statistics and other sources, the Michigan fact sheet has put together a number of graphics that make it easy to compare the energy production of all types of renewable energy sources. Below are examples of the two main types of data comparisons that the fact sheet displays, changes over time and differences between countries.
These graphs help translate the raw data presented by the EIA into something that is easier to understand at a glance. They are perfect for displaying simple, overarching trends for their respective fields, but their simplicity makes them ill-suited for handling data with many facets. This is where the following graphics excel.
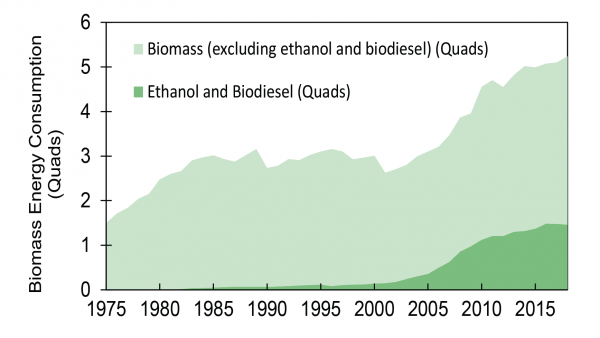
The field of energy production can be quite complex when accounting for all the various ways of generating energy and the scale at which that energy is generated/utilized. These graphics help the viewer understand this fact by visually differentiating between the individual sub-categories of a much larger piece of data.
This week I had the pleasure of exploring VizHealth.org, a data visualization site for the medical field run by the University of Michigan. My initial impressions on the site were mixed at best, as I was not sure how useful a site categorizing visualizations specific to the medical field would be to other areas. I am happy to say that this impression was completely untrue and I will most likely use VizHealth as a reference for any future infographic projects.
A Brief Synopsis
The opening page of VizHealth
VizHealth serves as a database detailing a wide variety of infographic examples and their potential uses. The two main features of the site are its gallery of infographic examples and, more importantly, a search wizard for finding infographic designs. Given the wide range of designs and searchable tags the site presents, they thankfully provide a simple but concise guide on how to navigate the site and attribute any of designs for your own use.
The VizHealth Wizard
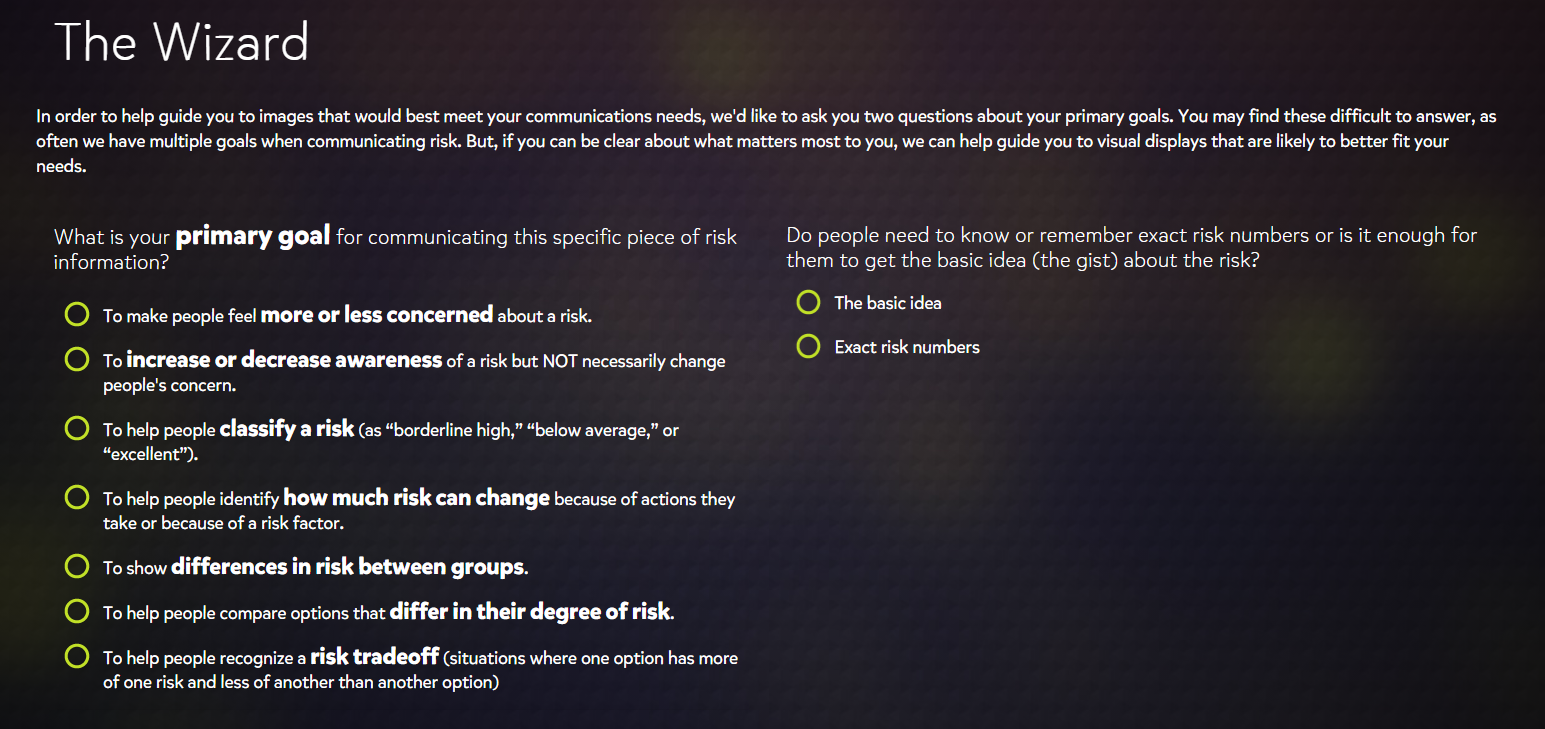
Serving as the main attraction of the site, the VizHealth wizard is an easy to use tool that allows you to quickly search for specific infographic designs based on a variety of criteria.
When I first viewed the wizard, I was surprised at how simplified the search criteria were. The eight primary goals were easy to understand while also being as non-specific as possible so that you could apply them other datasets that were not medical related.
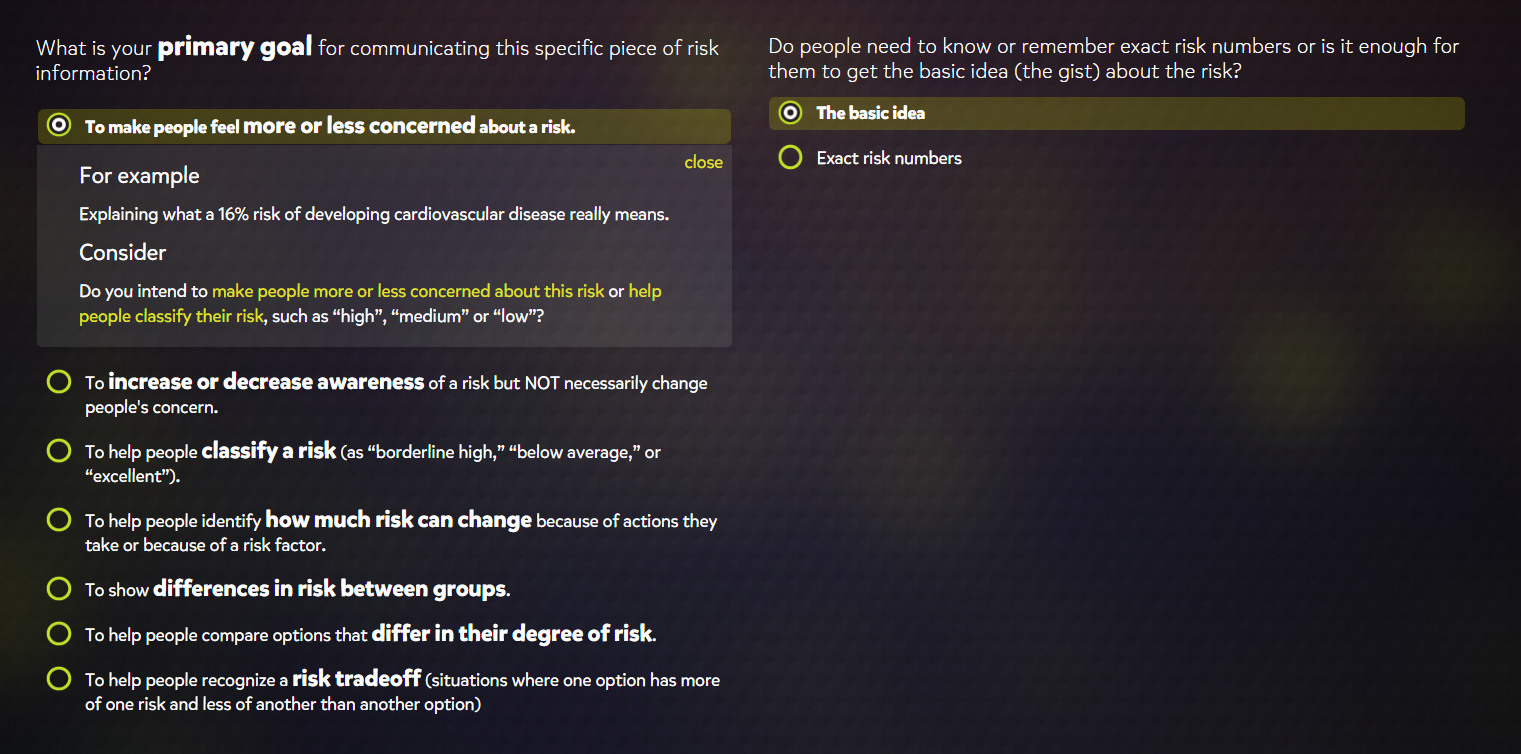
Selecting a graphic style also provided a short example of how the described graphic would be used and poses several questions that might help you confirm whether or not you choose the correct category. I found this to be a very useful addition as I had difficulty fully understanding the difference between the second and third to last options on the list. The filters for exact numbers and basic concepts were also useful features for determining graphic styles based on whether the graphic is meant for the general public or a more professional audience.
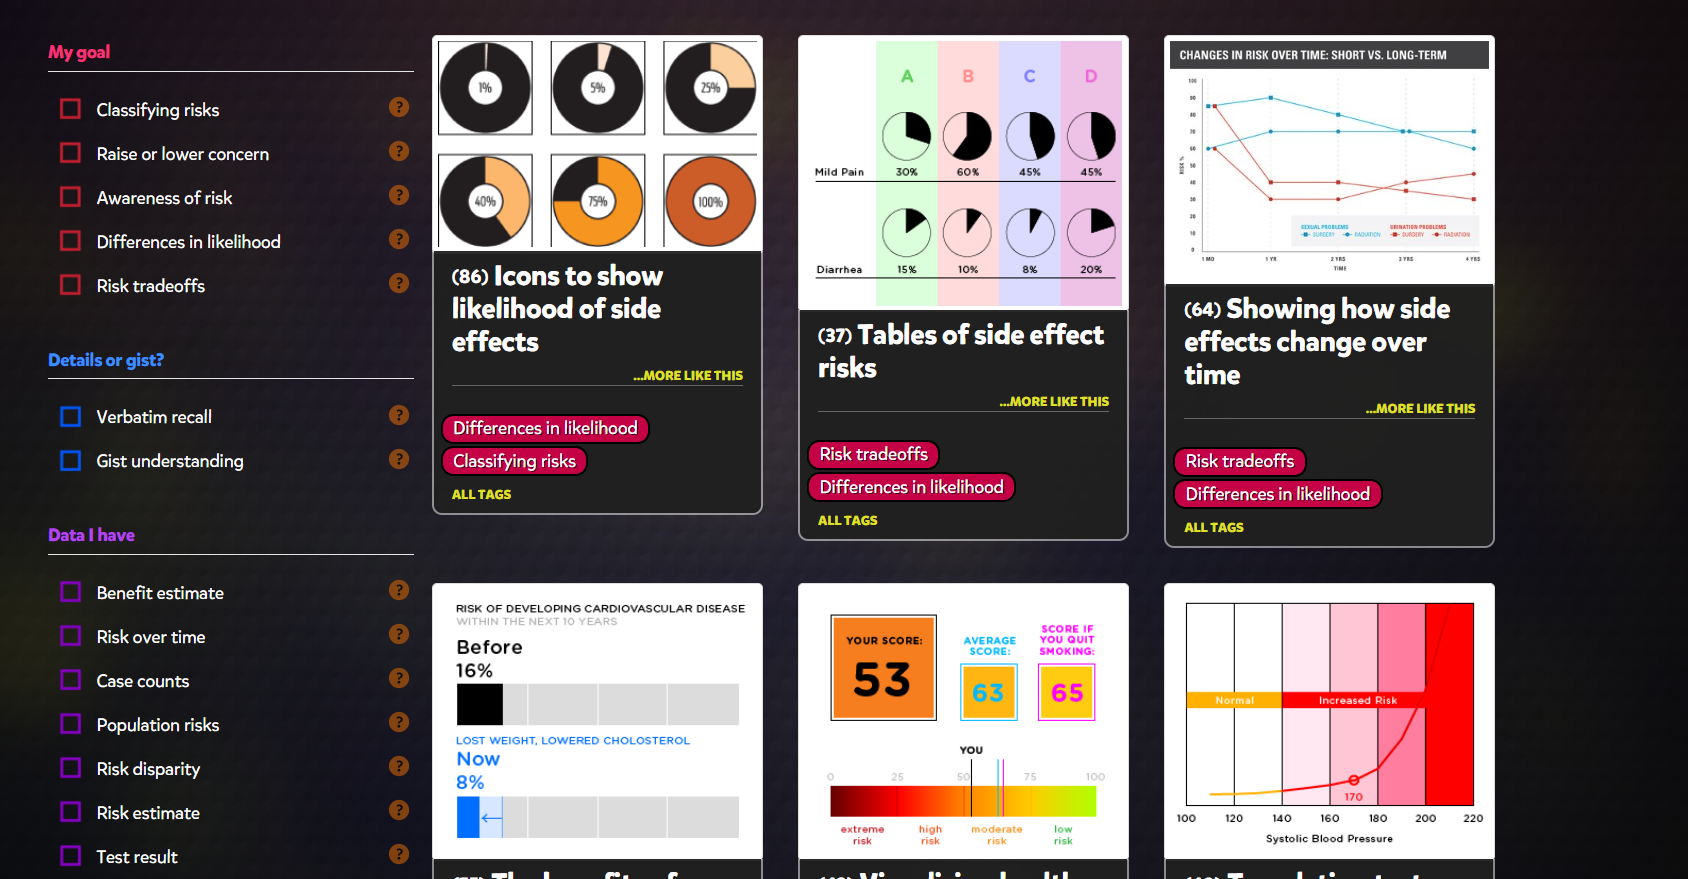
The Graphics Gallery
While I found the Wizard to be helpful overall if you are looking to design an infographic, I was much more interested in the actual graphics browser that accompanies it. This browser displayed about 50 different styles of graphics that all feel under the purpose categories that the Wizard describes. While there were quite a few styles that I was familiar with, there were also significant number that were new to me or that I had never really considered to be infographics.
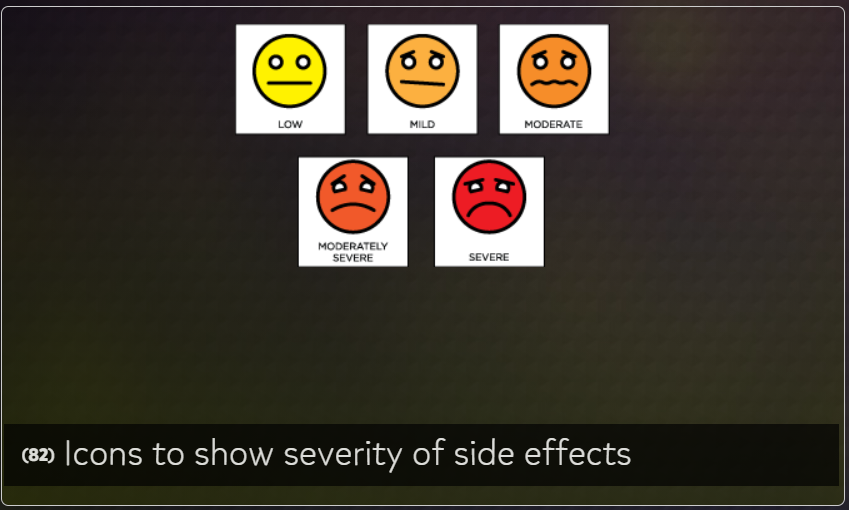
For example, we all have most likely seen this table at a doctor’s office and I had never realized it might be considered an appropriate way of displaying data. A variety of the presented graphics directly address this issue of determining if a graphic is appropriate for conveying certain types of data and the impacts they have had historically.
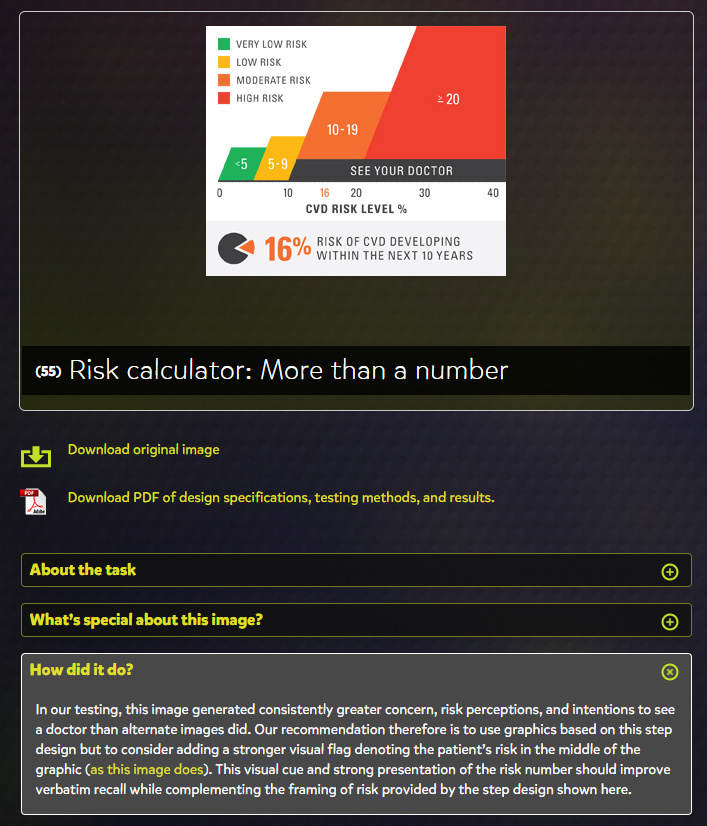
The “How did it do?” tab is the perfect addition to the site, as it allowed me to learn more about how well these different styles performed and any issues that arose from their use.
Final Thoughts
Overall, VizHealth seems to be perfect tool to get a wide-scale idea of the various styles of infographics that have been used in the past and provides fantastic information on how effective each is at their prescribed role. The Wizard is a great jumping off point for designing infographics when you are unsure of what kinds of visualizations are appropriate for your data set. I will definitely be using this site as a resource for when I have to
Since their inception in the late 1700’s, infographics have proven themselves to be invaluable tools for neatly visualizing data and presenting it to the public at large. These early graphics mainly focused on topics relating to business, such as with the case of the first recorded infographic which related wheat prices to labor wages, or geographic information. Some examples of these graphics can be found by following this link to Atlas Obscura. As the field of data visualization has grown and infographics have become more complex, encompassing a much wider variety of topics, several infographic archetypes have been created.
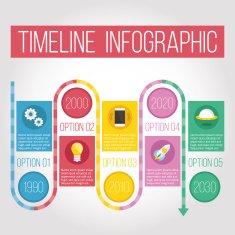
The Timeline
Timeline infographics are best used for displaying the evolution of a certain topic/data set over time.
2. Data Visualizations
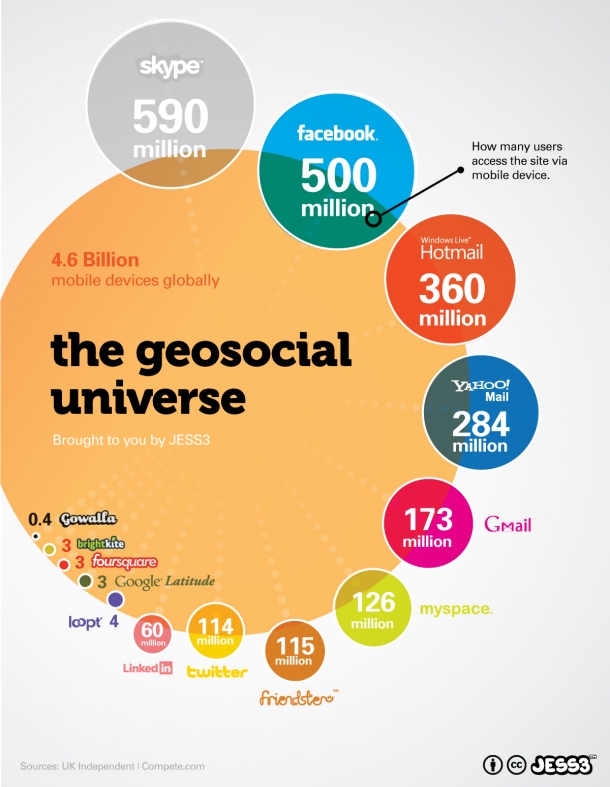
Data Visualizations are artistic ways of presenting a wide variety of data sets to an audience in such a way that they are easy to interact with, allowing the audience to better understand and remember the presented dat.
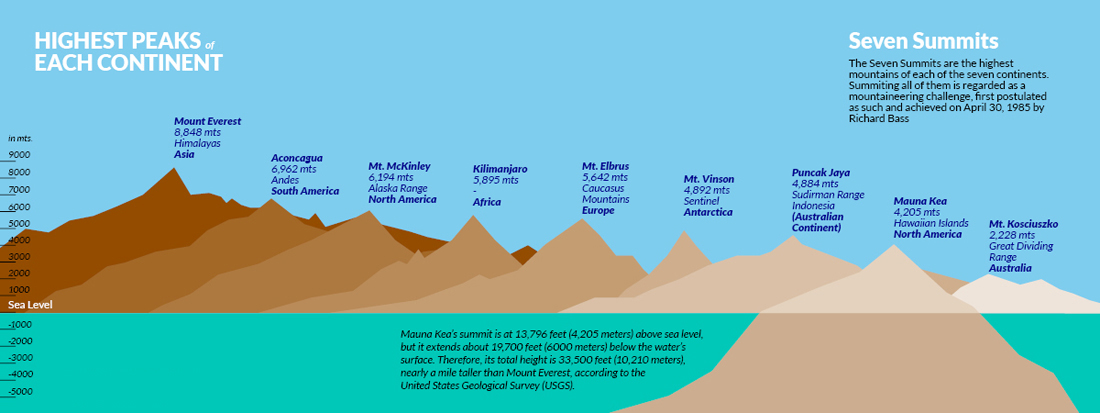
3. The Comparison
Comparison infographics are used to highlight similarities and differences between sets of data or particular topics, such as mountains in the example shown above.
4. The Geographic
Geographic infographic are focused on displaying data sets that can be related to geographic information, such as population densities or economic output of certain regions.
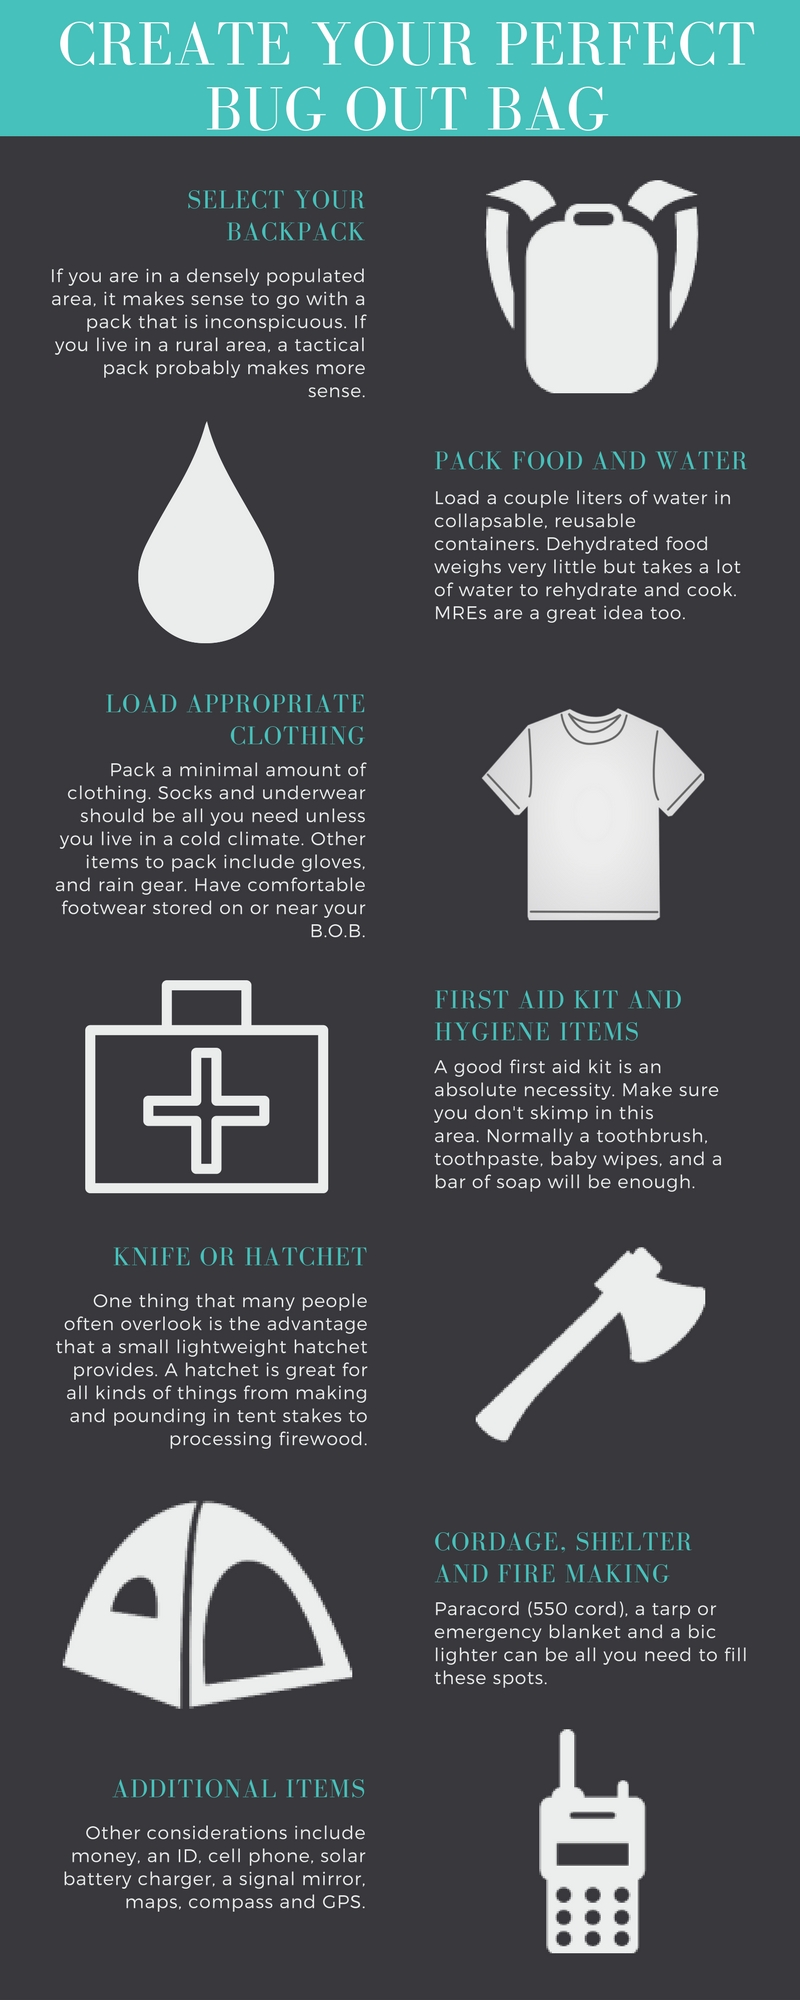
5. The List/Visualized Article
This type of infographic serves to summarize an otherwise lengthy article and distill its finer points into a list of short blurbs. Care must be taken to make sure that the important messages of the original source are properly translated into the graphic.
6. The Statistical
Statistical infographics serve to consolidate statistical data sets into a graphical image in much the same way as data visualizations. The key difference between the two is that statistical infographics are focused more on the presentation of hard numbers rather artistic designs. Anyone who has worked with data management programs like Excel should be familiar with the most basic of statistical infographics, such as pie charts and line graphs.
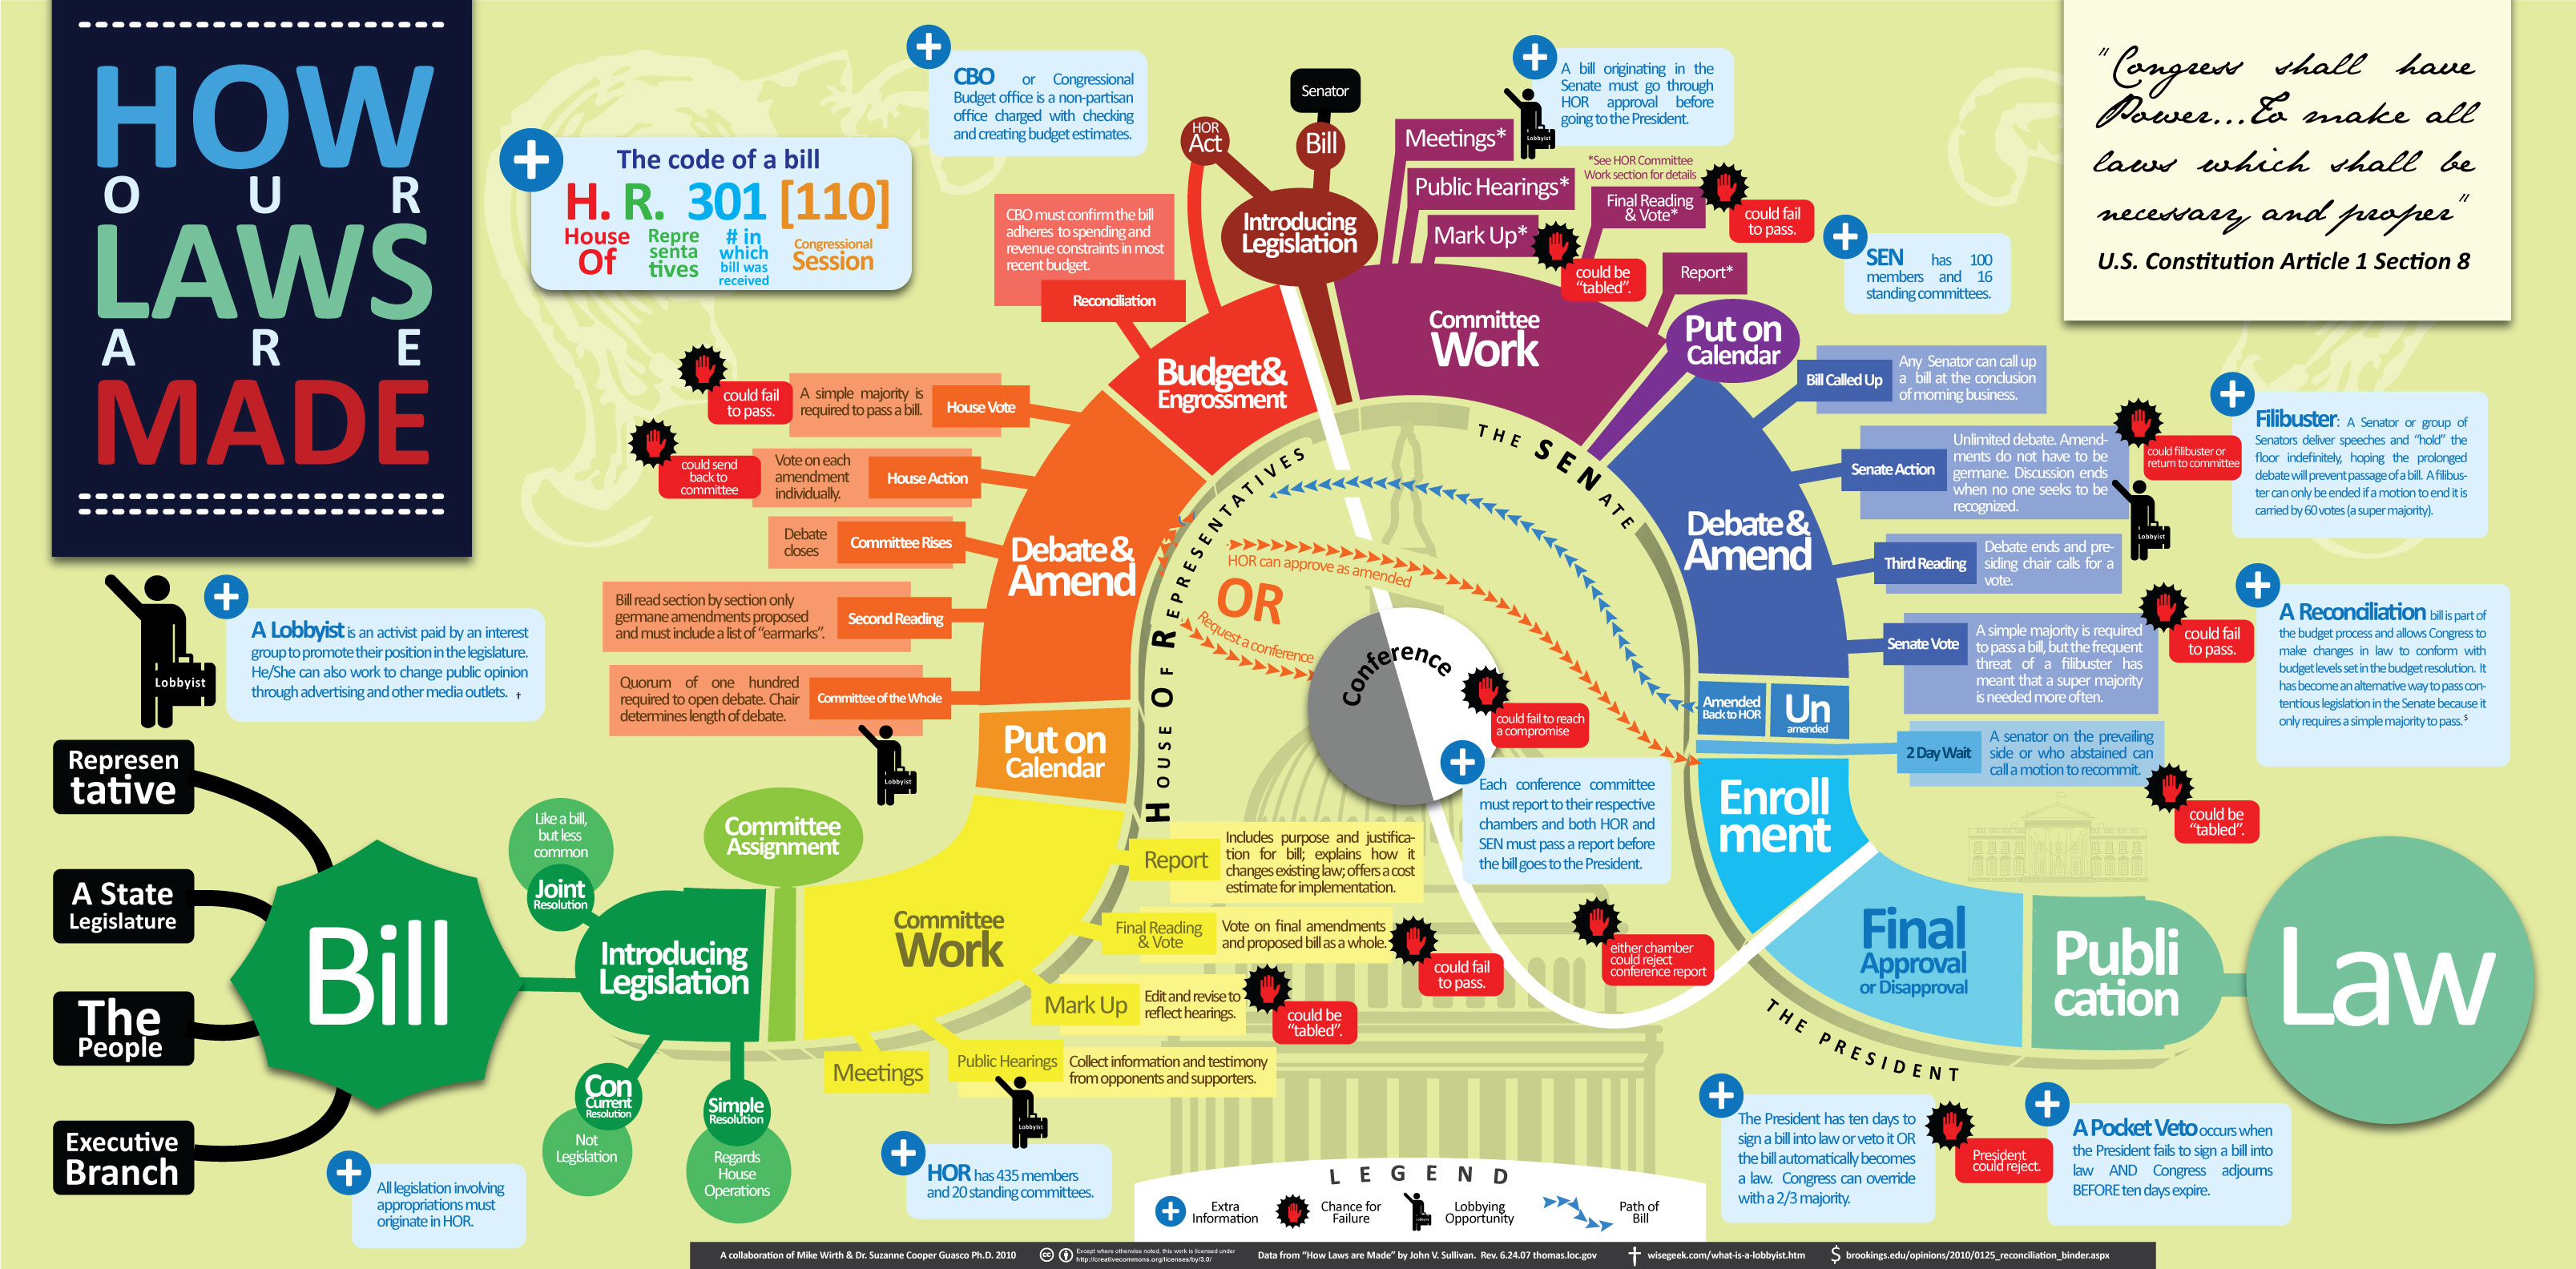
7. The Process
Process infographics display the order i which events tend to occur regarding a specific topic, such as with how laws are passed in the example given above. These graphics are separated from timelines due to the fact that the progression of time is not a necessity for the creation of a process infographic, as it relies only on the order of events and not on when the events occur.
Tools to Help Create Infographics
Creating organized and eye-catching infographics from scratch can be a difficult task. For this reason, I have put together a list of sites and resources that make creating infographics a breeze.
Canva.com – allows limited creation of infographics with a free account
Venngage.com – similar to Canva and Easely, but with a more limited scope for free student accounts
Adobe Spark – Spark allows full access to college students and provides a wide range of graphic styles and tools
These are just a few examples out there that greatly simplify the process of creating infographics. There are other sites that offer similar services, but these are usually limited in scope with a free account. In terms of generating simple charts and other quick data visualizations, Microsoft Excel and Google Sheets are the best choices available to you.
Interesting Data Sets
I am a Sustainability major who is concentrating in Energy, so I am very interested in all things related to energy efficiency and generation. I managed to pull together a few different sets of data relevant to the field of Sustainability which you can find below.


