Categories
data visualizations Examples

Lollipop Chart

The Lollipop chart seemed like a lot of special formatting from the beginning and I was pretty much right. It is just a bar graph that you edit to make it look better. As always, I spent way to long looking for data, but stumbled upon BTS pre-order sale numbers while I was taking a break on Twitter. It took a lot of time and it probably isn’t a type of graph I would use often, but the style is easier on the eyes that a bar graph, especially if there are a lot of bars.

BTS official album pre-sale numbers from 2015-Present

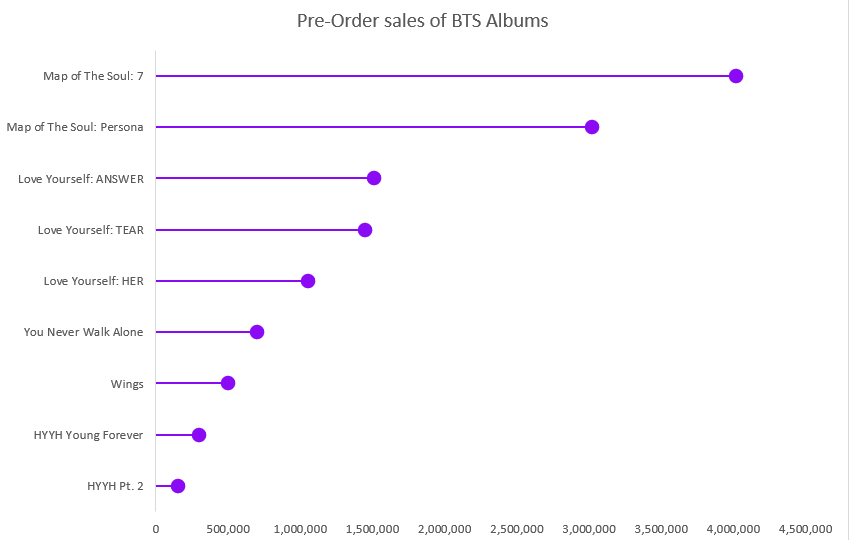
Like I said before, lollipop charts are best used when you have a lot of data to display, at least 20 different points, unlike my 9. It’s also saves on ink if someone would be printing this out to give to people or hand up. My biggest problem with this is that the circles aren’t an accurate representation of the number, the data point is located at the center of the dot and that makes it harder to read the true number. If you aren’t looking to be so precise with the visual and are looking to just show how the data points relate to each other, then using this graph is fine.

Categories
Uncategorized Visualization Tools

Visualizing Health

Homepage of VizHealth.org

When I first opened Visualizing Health homepage, I noticed the title graphic and the yellow text. The title isn’t overall complicated and easy to read. Looking closer, I realized that all the yellow text are links to other pages of the site, licenses, and emails. All are clickable links that a person can use to get information from and help recognize what they can click on.

Screenshot of video

Finding information about the project was very easy and they even added a video that helps explain their goals, how they put the wizard together and how was involved with the project.

The Wizard

The wizard was, to me, fun to use. It started out with 2 two questions, what is your primary goal of the infographic and how specific you want it to be. This is great because it help narrow down your choices and makes jumping into making an infographic less overwhelming. Starting small and specific is best and then you can always work up.

First page of the wizard

It then brought you to the gallery with samples of graphic based on the specifications that you chose. On the right hand side (screenshot on left) shows a menu with the same parameters that you were giving at first, with yours selected. Below your first options are more specific sections you can chose to help narrow down the type of graphic you need. It can help cater to the type of data you are working with, rather than have a general graphic. You can also select the type of graph you wanted, whether it was a bar graph, table, icon, or pie chart, etc. Using the Wizard was really straight forward and easy to navigate.

Menu for finding graphic

The site also gives tips on how to create icons, use images, and assess risks for the infographic. This site seems especially helpful to people in a medical field or people/companies that want to spread awareness about diseases or other health risks.