By: Taylor Alotto
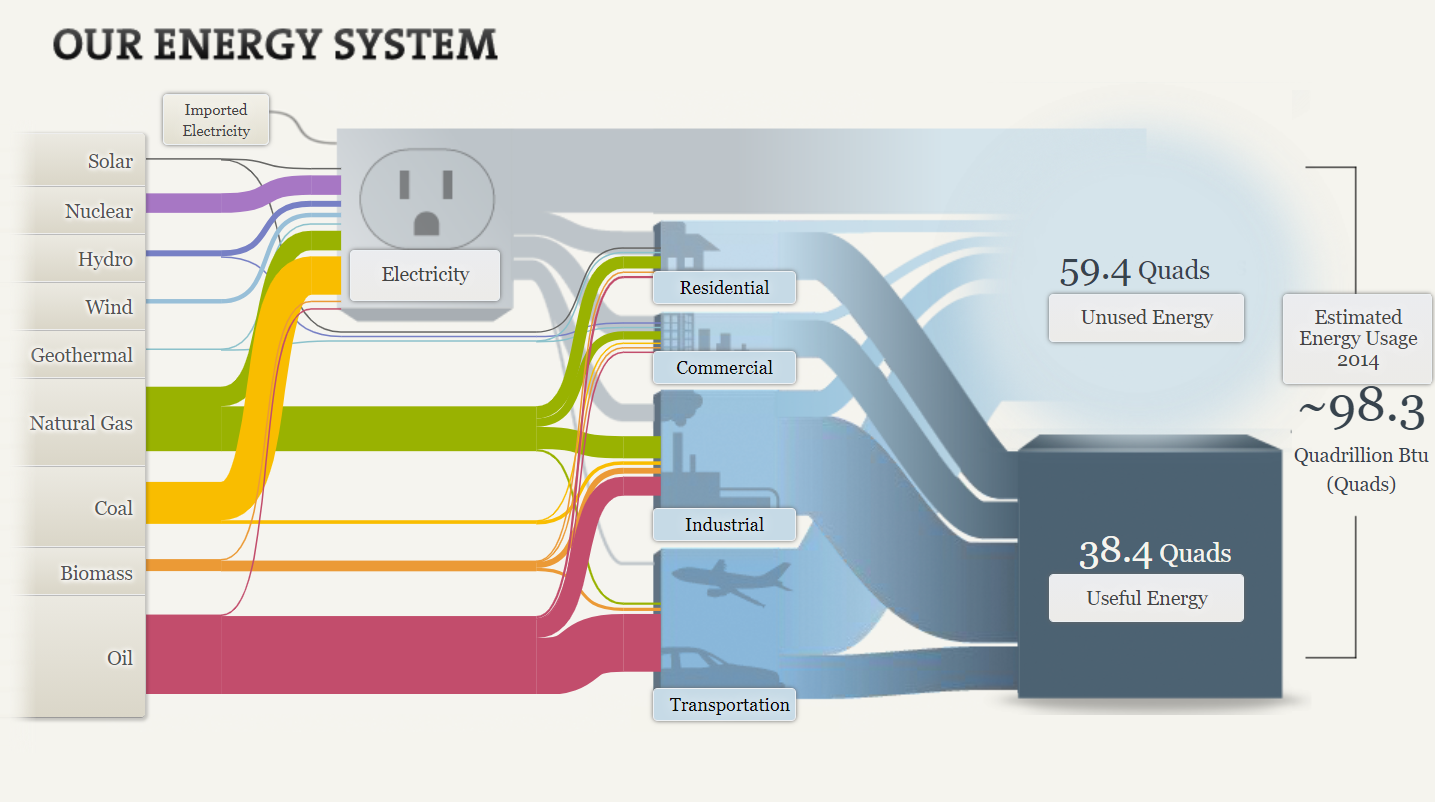
The Sankey website provides visuals to educate viewers on our energy systems. This website begins by displaying the flow of energy in the U.S. through interactive visuals. I clicked on the tab “Our energy system,” to see the overview and layout of information provided. Below, is an interactive chart that is displayed on the Sankey website. It shows how much of each type of energy is used, providing details upon clicking each link. Oil is the most common energy source. This visual can be easier then reading a piece of text, because it shows exactly where things go. The colors may help trigger the memory and draw the viewer in.
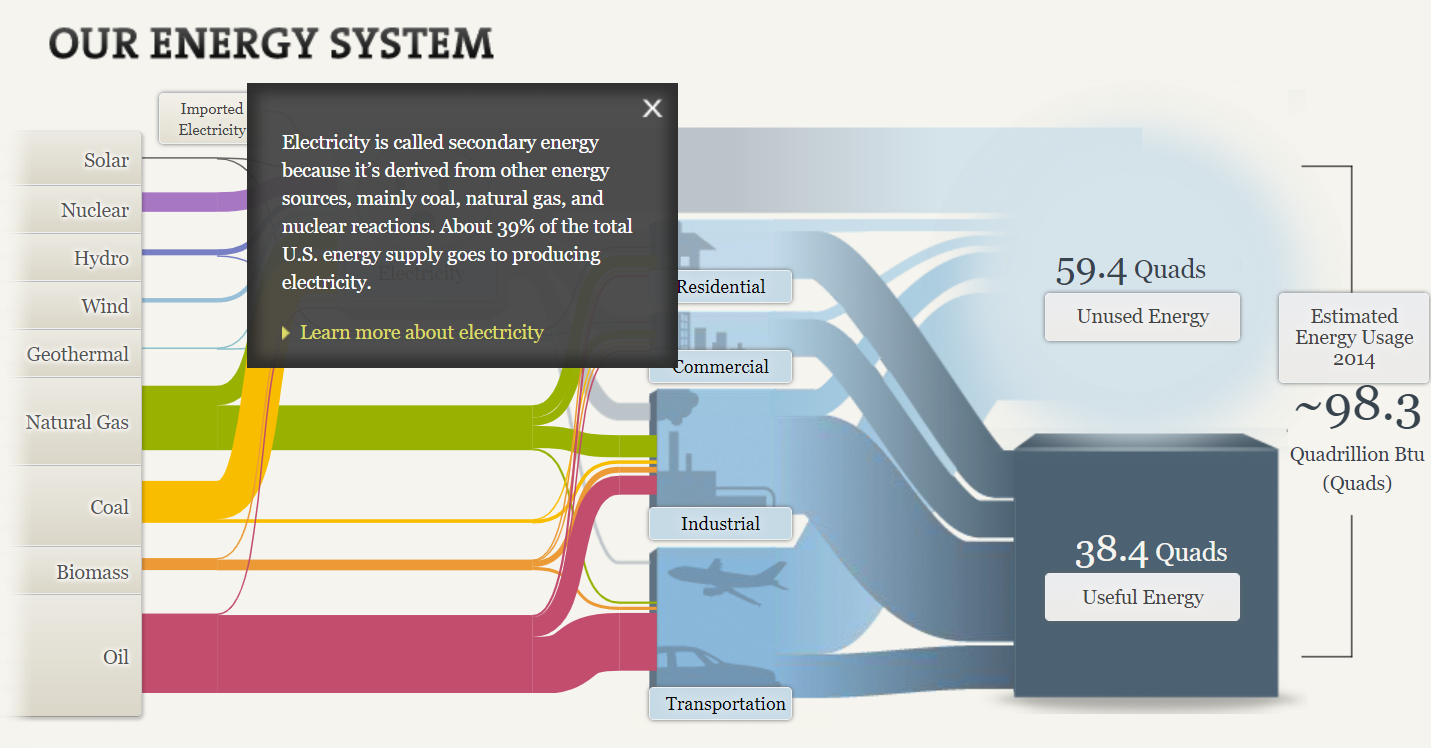
I clicked on “electricity.” As you can see below, a text box pops up, providing information that they want you to know regarding electricity. From this text box we can gather than electricity is secondary energy that is derived from other energy sources. This website gives you the ability to click on any word displayed below, following a textbox, that will provide you with more information about it. I really liked this tool and thought it was a fun and interactive way to retain information.
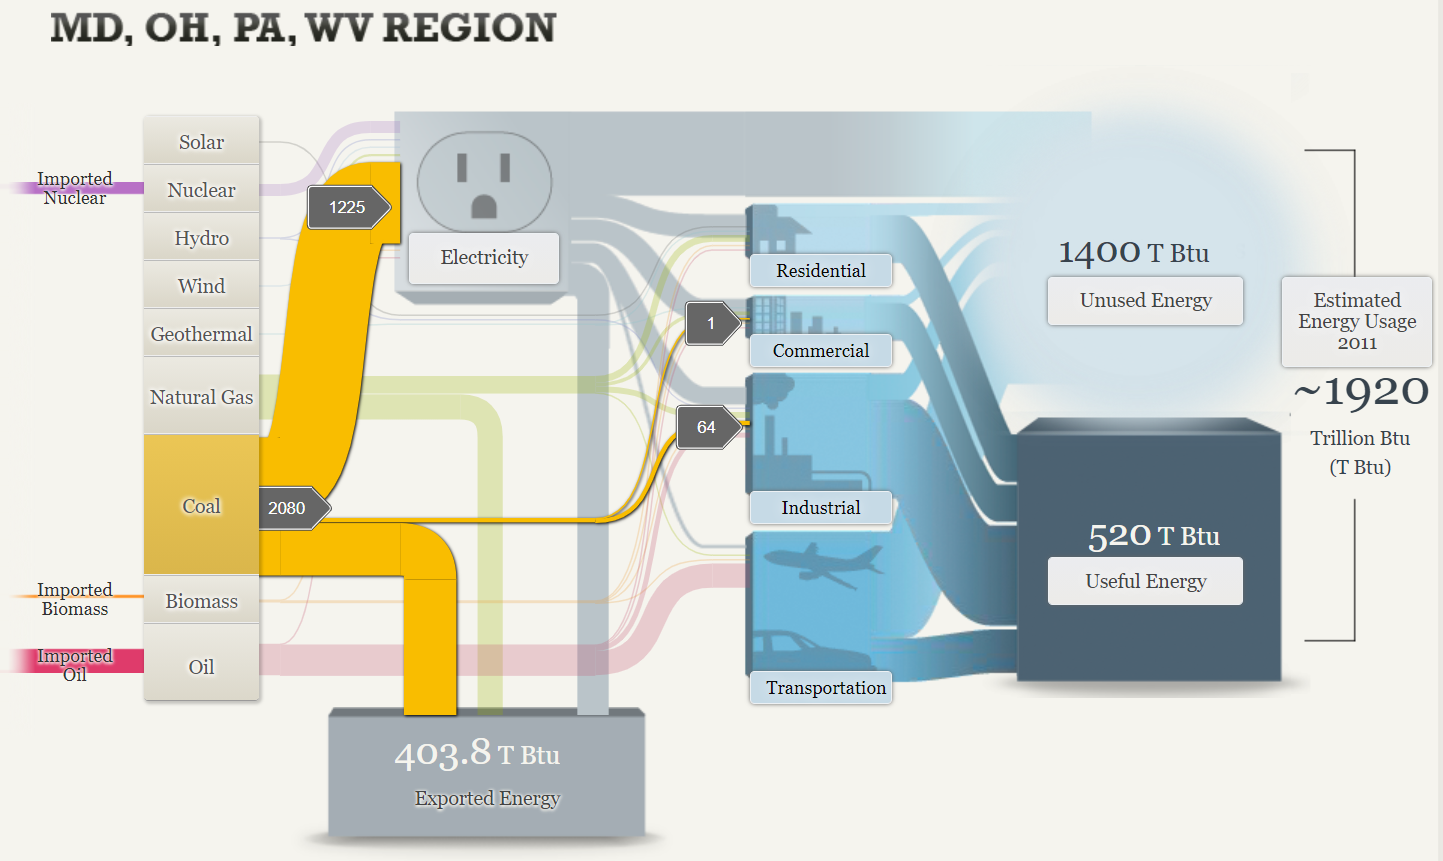
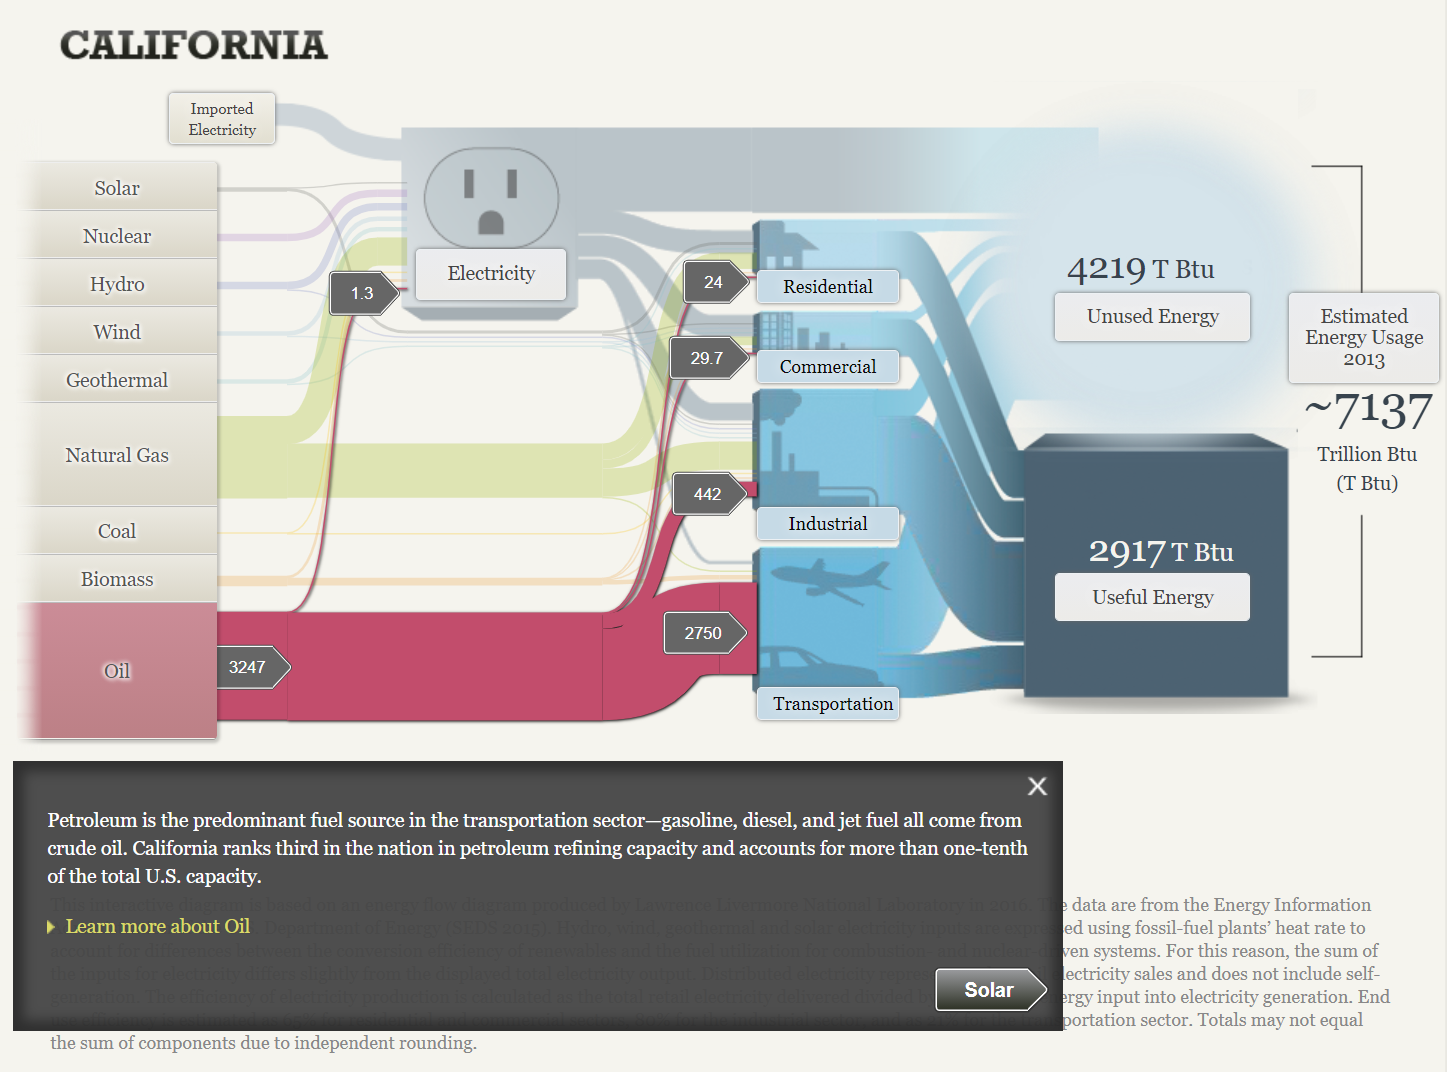
Below are two other tabs on the Sankey site that provide information about our energy system based on location. As you can see, in MD, OH, PA and WV region, coal is the most popular energy source. In California, oil is the most popular energy source.
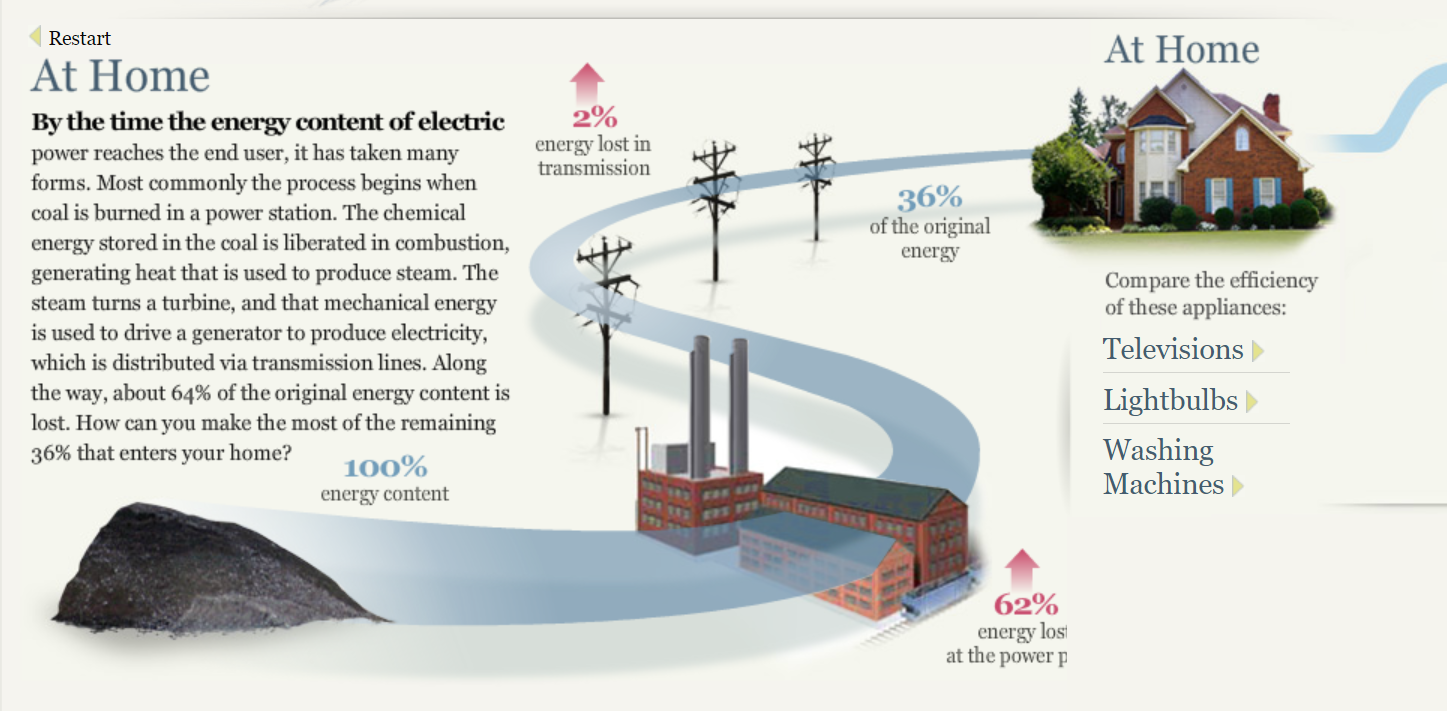
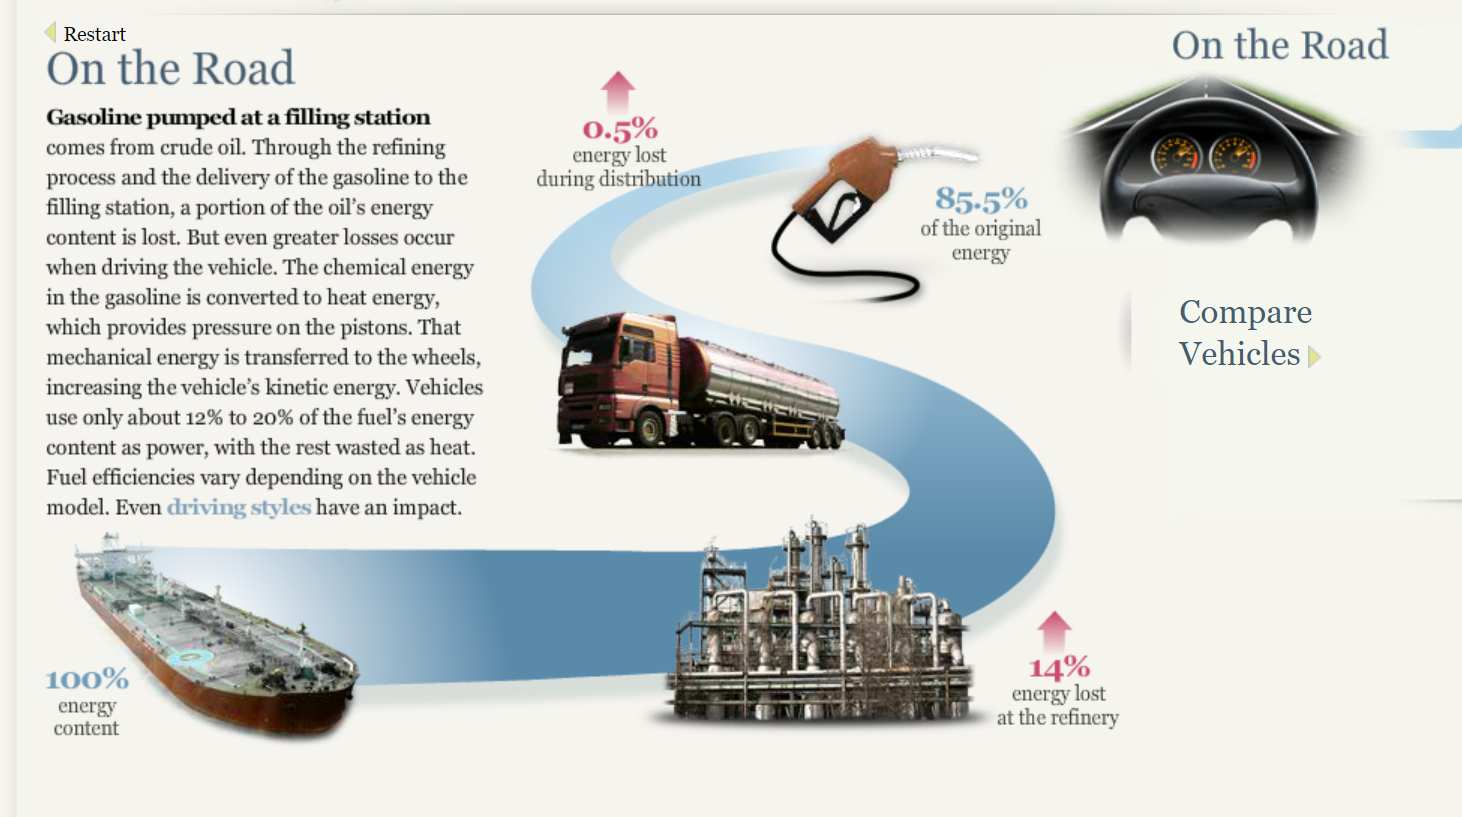
After further exploration of this site, I found visuals displaying information regarding energy at home and energy on the road. Pictures and visuals definitely drew me in, making it easier to process what is being explained.
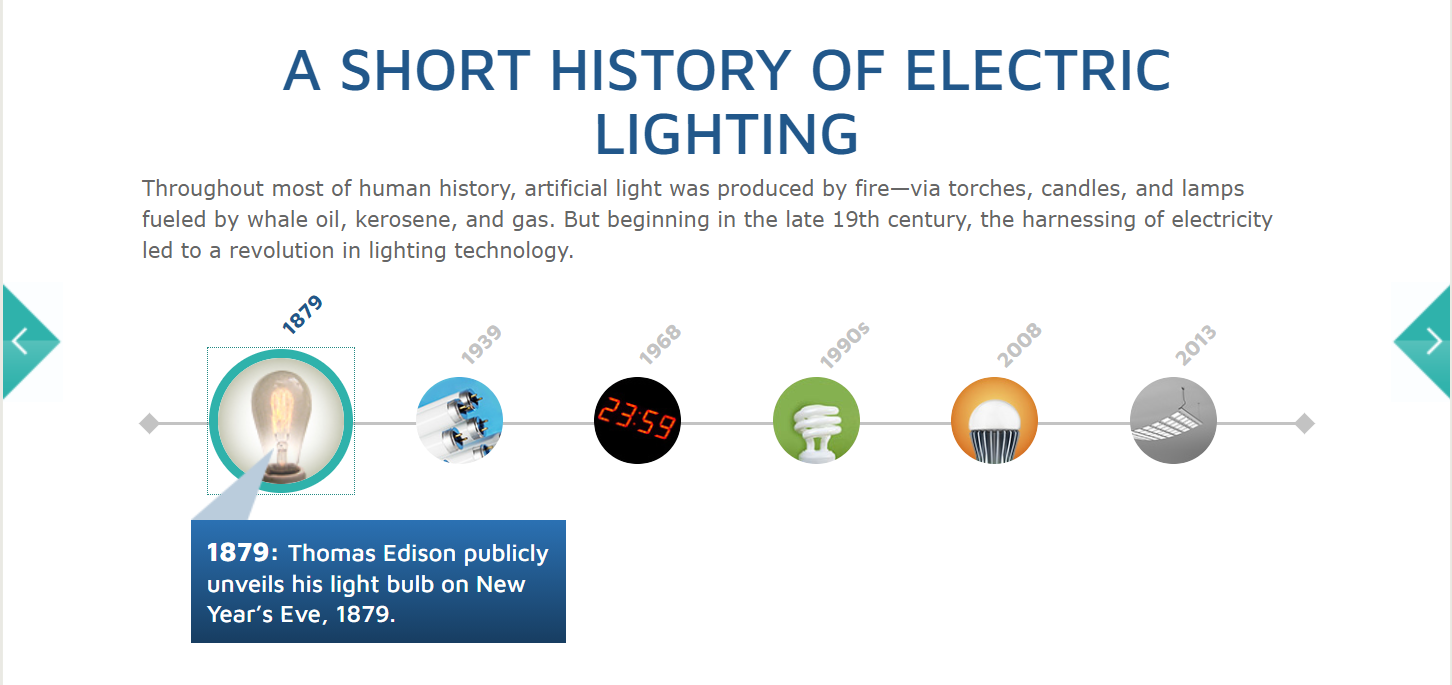
Lastly, I learned about the history of electric lighting. This is an interactive timeline, providing a picture, date, and facts. I find interactive charts and timelines to be very fun. They help you remember what you are reading.
Overall, I thought Sankey was a fun, interactive site, teaching about our energy system in a way that was very visual. This site provided information about the uses, costs, sources, and efficiency of our energy system. I really like the way this data was displayed.