The Sankey Energy Visualization was good way to express energy consumption data to an audience. But it is more involved and requires a bit more effort in order to understand what is going on. The basic set up of the cables going to each industry such as commercial, residential, industrial, and transportation do a look a bit messy but require some focus to follow to each catagory. Below is a picture of the basic set up of this interactive visualalzation.
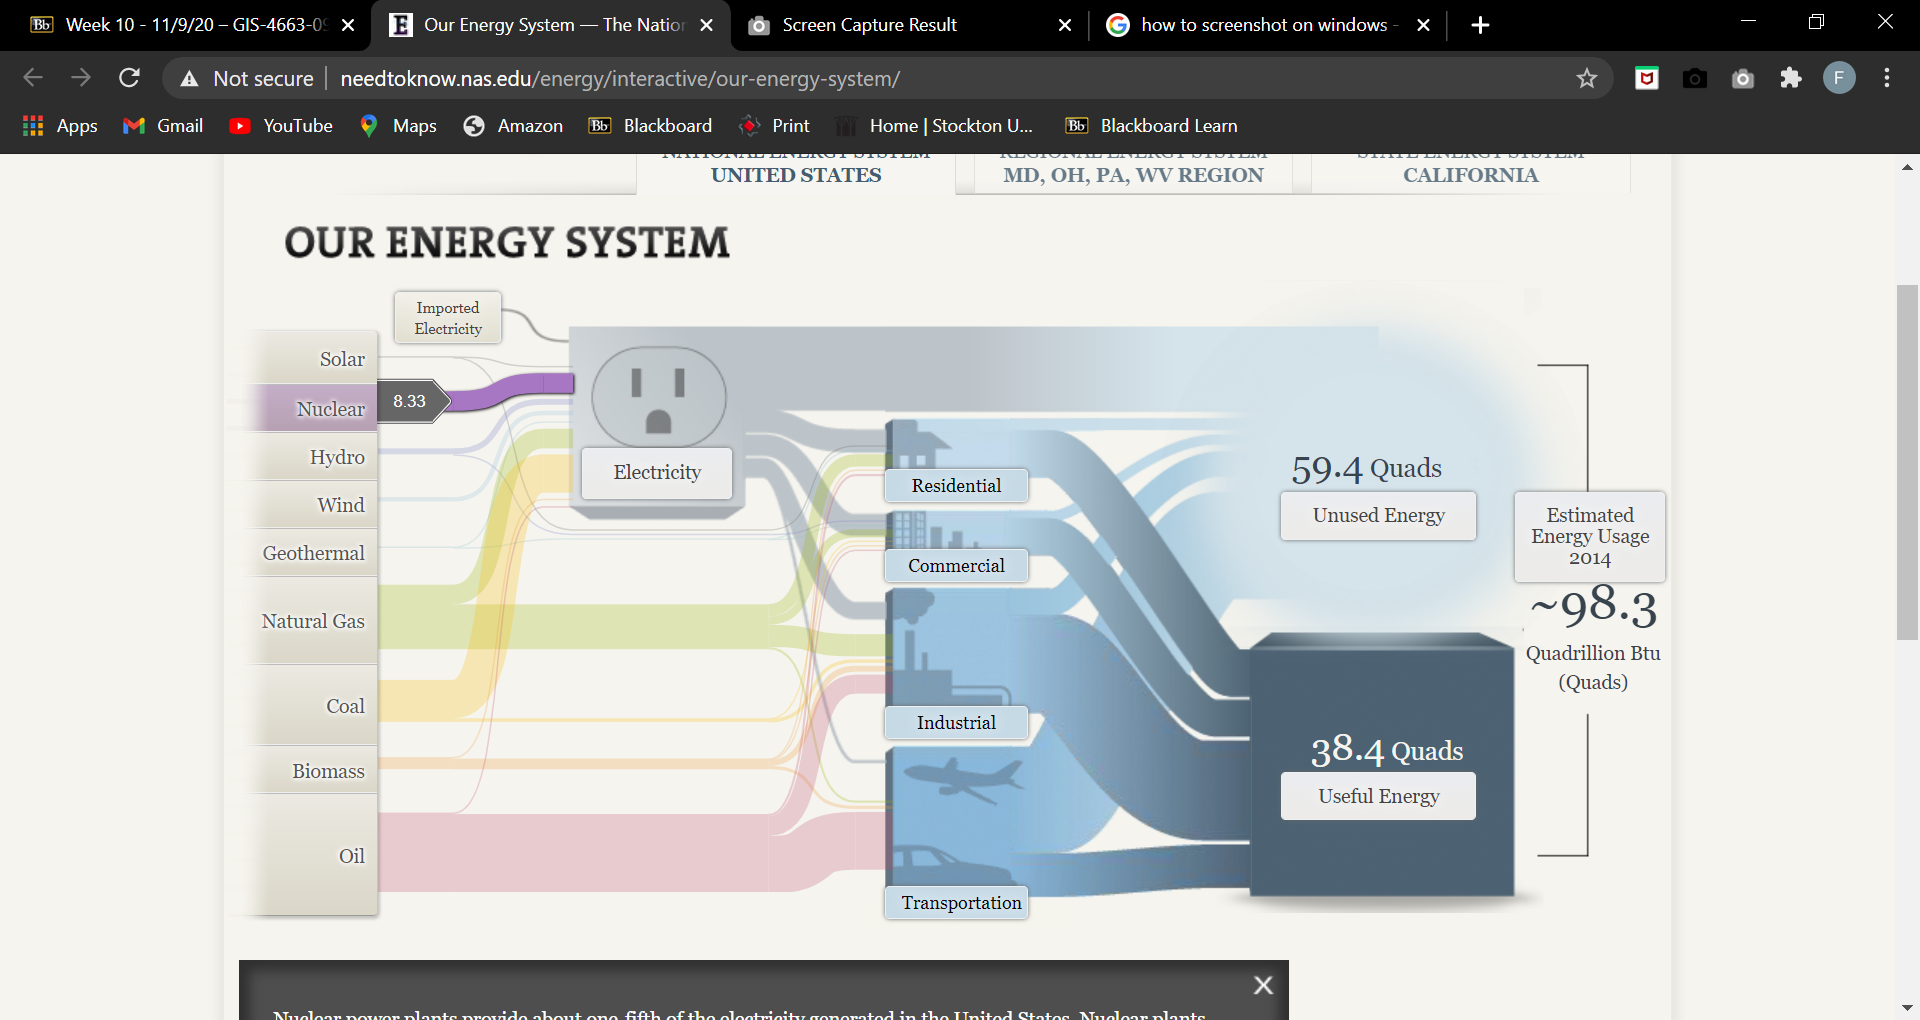
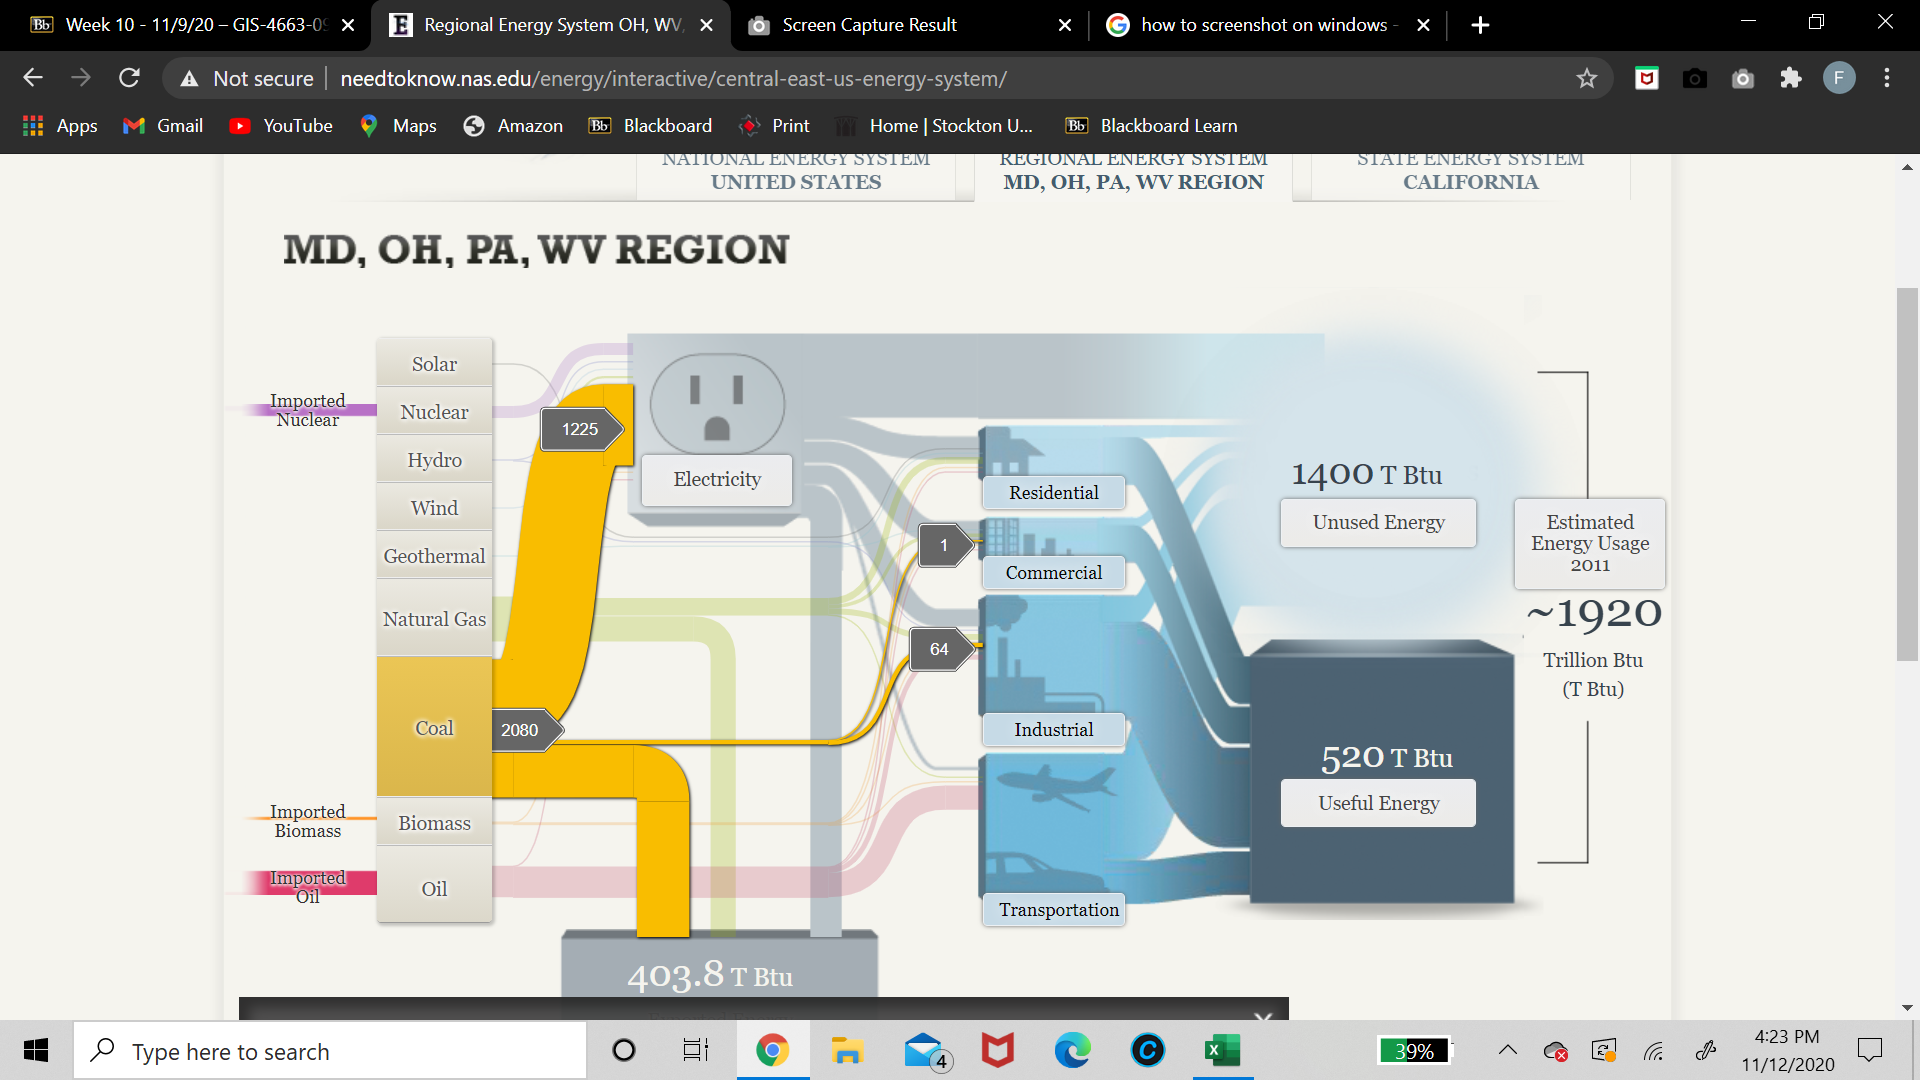
However, once understood, the Sankey Energy Visualization becomes a great source of information. One thing i did find intresting was that the entire nation relies on nuclear energy for electricty. I found this out by clicking on the nuclear energy tab. One thing that was not suprising was that regional energy system of MA, OH, PA and WV relies on coal for their main soure of electricity. This wasnt to suprising as these regions are dominated by coal. Below is a screen shot of how i found that out
All togther The Sankey Energy Visualization is a great interactive data visualization as long as you take a couple minutes to nagivate through it and understand it fully!