I think Lollipop Graphs are really interesting and creative ways to show your data. The first interesting thing is that you can create them in one of two ways: Either through Scatter Plot Graphs or through Bar Charts.
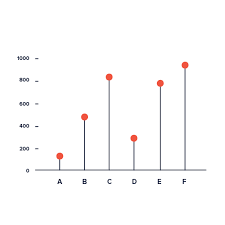
Lollipop Graphs are very simple, yet they show you exactly what you need. and that’s their exact purpose.
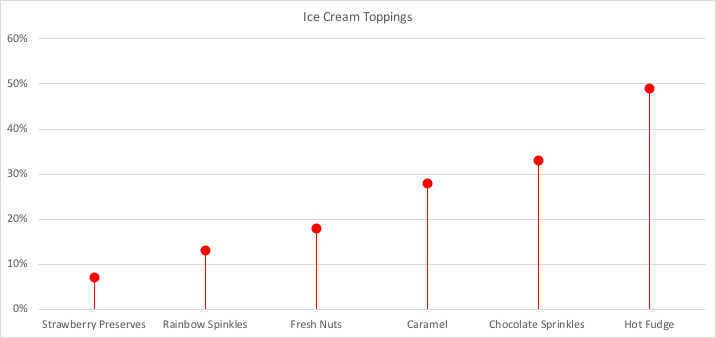
In my Lollipop Graph, I chose a data set about popular ice cream toppings. I chose to show them in ascending order because I thought it looked a lot better. It is very minimalistic, but I believe it gets the point across.
While doing some more research, I found some more variation of Lollipop charts like the ‘Cleveland Dot Plot’, which has a shorter line and shows two subgroups. More of these examples can be found at https://www.data-to-viz.com/graph/lollipop.html.