
The lollipop chart is a composite chart with bars and circles. It is a variant of the bar chart with a circle at the end, to highlight the data value. Like a bar chart, a lollipop chart is used to compare categorical data. They are visually different alternatives. For this kind of composite chart, we are able to use more visual elements to convey information. The lollipop chart is to be useful compared to a normal bar chart. It is best to use a lollipop chart if you are dealing with a large number of values and when the values are all high. This kind of graph can replace column and bar graphs.
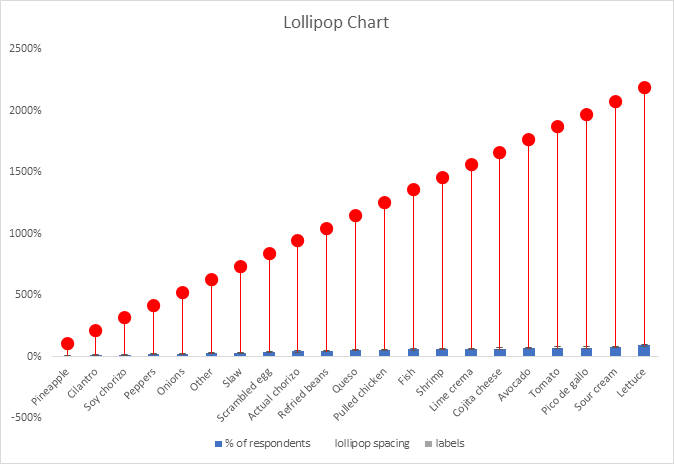
Below is the Lollipop Chart that I created. There is a lot of data in this chart and there are also high percentages. Therefore, a lollipop chart is a great choice to represent this data.
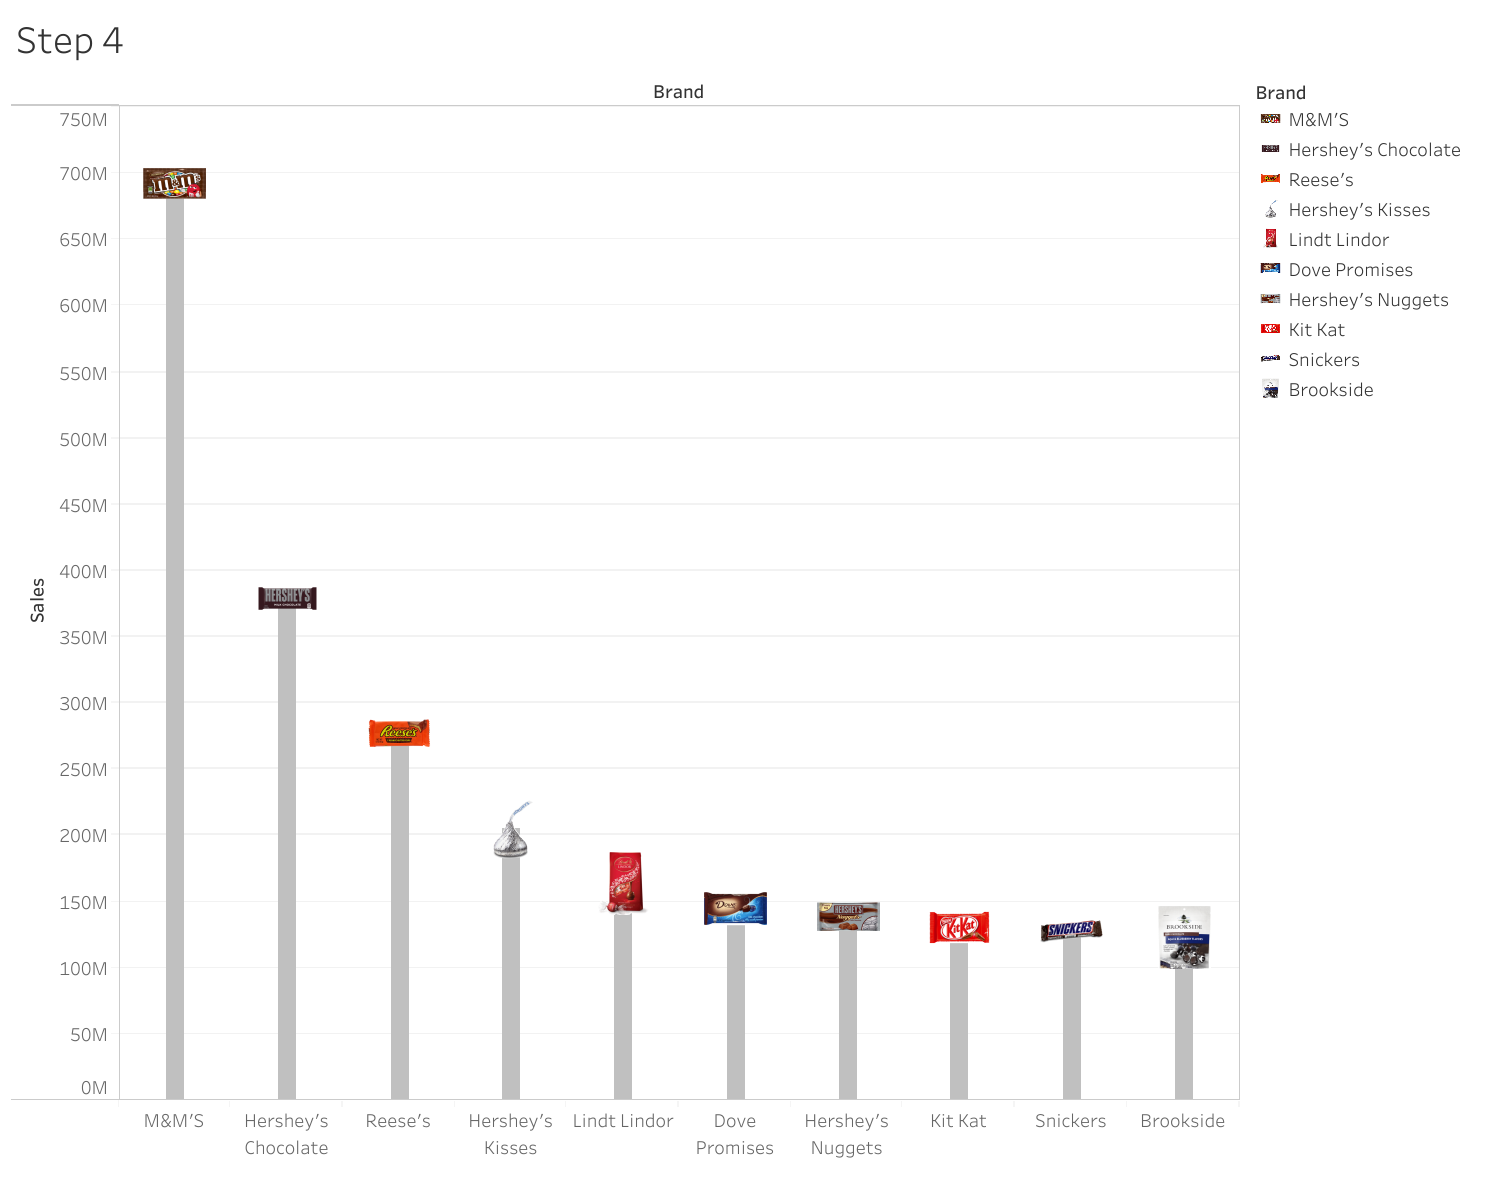
This is also another example of a Lollipop chart I came across that is a slightly different. This chart was not created by me. I found it so cool how this chart was created and the details that were added. I am linking the website where I found this chart, because the site also shares how to create a lollipop chart. Another cool detail about this site is the graphs are interactive. Check it out! I found the information that was provided on the site useful.
3 replies on “Lollipop Chart”
I love how visually appealing your blog is, it is clean concise but personalized. I also very much love the chart you shared from the website its a cute idea to use an icon as the top of a lollipop chart but it also seems to the pictograph. Where did you create your chart? I wasn’t sure if you mentioned it or not but it is nicely done and I was wondering if it was excel?
I found another website that has a similar lollipop chart using an icon as the marker. just wanted to share…https://datavizproject.com/data-type/lollipop-chart/
One of my unreached goals in making these charts was using images as the lollipop head, But it went horribly for me, so I am impressed you got it to work
For something you could do different, maybe putting the image inside of a sphere so that the image acts as a ‘filling’ for the lillipop
I like them.
I though that the course is not so difficult for us, the senior students at University. However, after 6 weeks, I changed my mind. Beside its usefulness, it required us to spend certain attention to be able to gain the course’s outcome. Do you think so?