In business, benchmarking is used to measure a company’s success. If you can see a clear and present gap, you can figure out what to fix before things get out of hand. Companies can gain a competitive edge by studying their competitors and can have a fighting chance.
There are lots of different ways to represent a benchmark on a graph. Sometimes it’s as simple as making a line, other times you have to compare multiple things so one line won’t do.
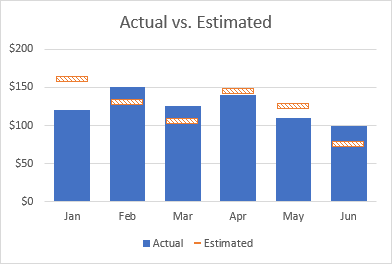
A benchmark is essential a goal for a company to set. You reach that goal by just passing the line. In my first example, you can see in June, the company set the benchmark very low and were able to pass it.

In this graph, the company us representing the frequency for all of their fatalities. This is a benchmark that you would want to see decreasing.
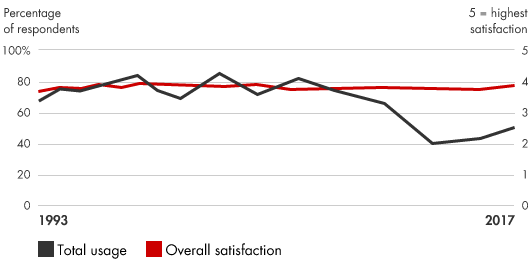
Companies can use this data to show how well their products are doing. While the overall satisfaction is remaining constant, the company has seen a dramatic decrease in the usage of their product. This can tell a company that they need to make a change in their production.
https://www.bain.com/insights/management-tools-benchmarking/
https://www.icmm.com/safety-data-2018