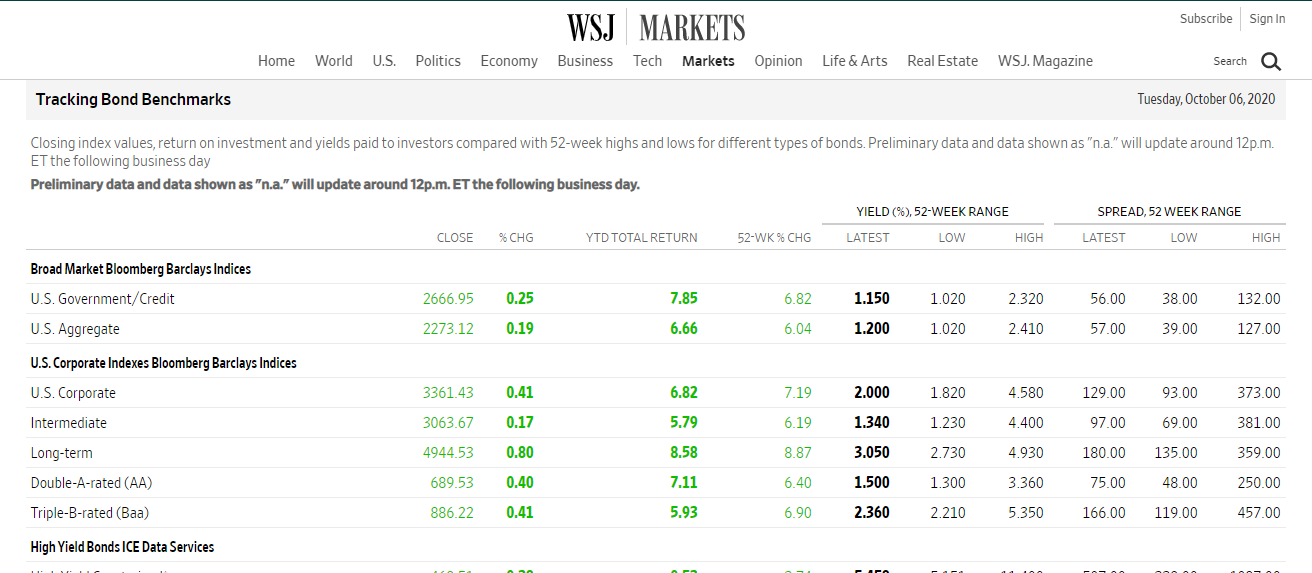
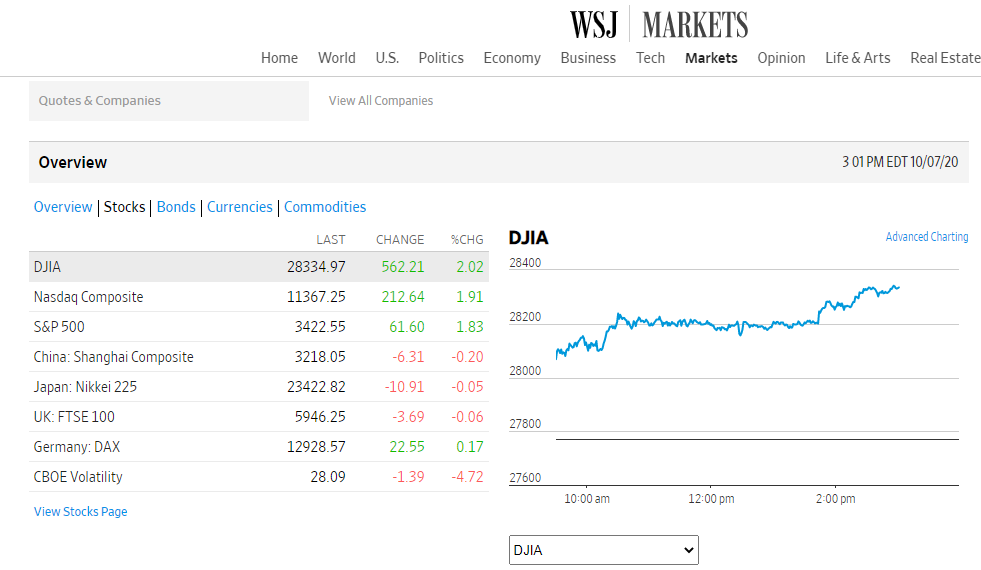
Benchmarking by definition means “A standard or point of reference against which things may be compared or assessed”. This management tool has been around and widely utilized by many businesses for centuries. It may seem like a simple graph or picture, but it adds great quality and a deeper meaning to a story. It helps users understand performances between different organizations’ products and prices for example the rise and fall of the stock market.

T-Mobile uses pink in every advertisement, poster, or package, and the letter T stands out from other companies.

The Wall Street Journal (WSJ) is a highly respected newspaper that uses a benchmark to compare the stock market, businesses, travel, and other topics of interest occurring in the U.S and around the world. One way WSJ makes comparisons is by using charts with line graphs to represent and explain data.
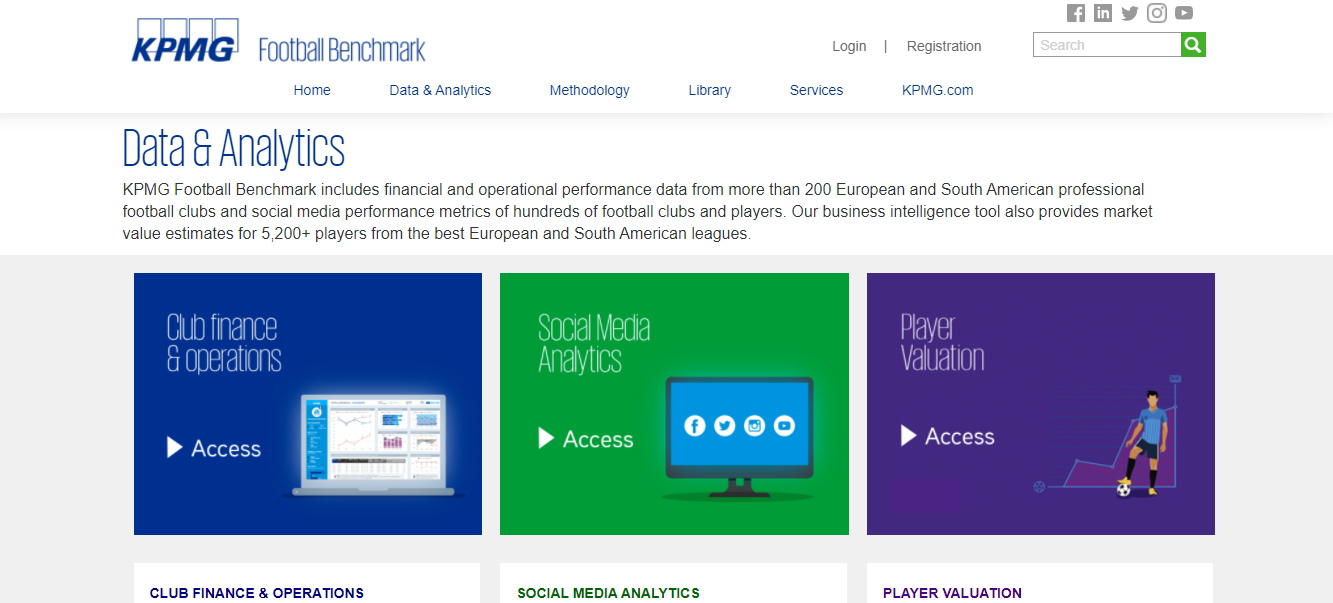
Football (Soccer) Clubs use benchmarks to compare games, players, financial opportunities across Europe, and Sout America. It also uses a benchmark to compare contracts for players.

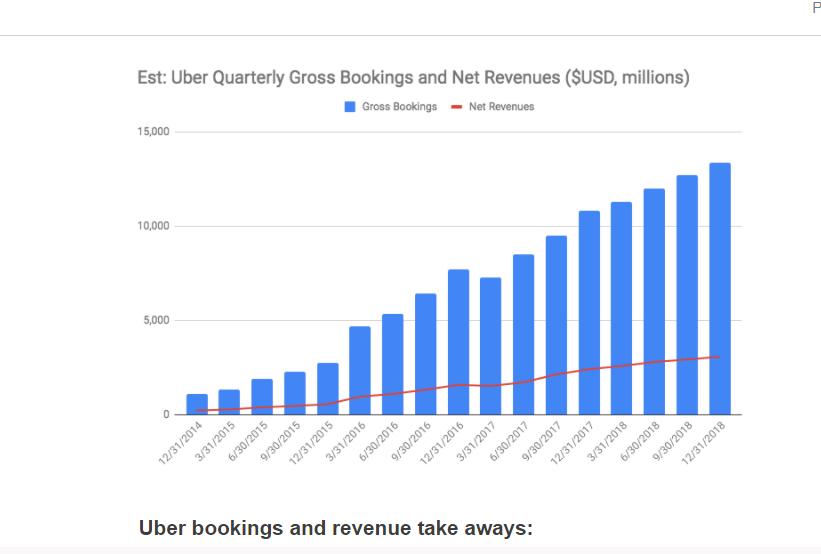
Here is another great example of a benchmark used to compare Uber Gross Bookings & net Revenues from 2014 to 2018. Based on the chart, Uber’s bookings and revenues were very impressive throughout the years.

