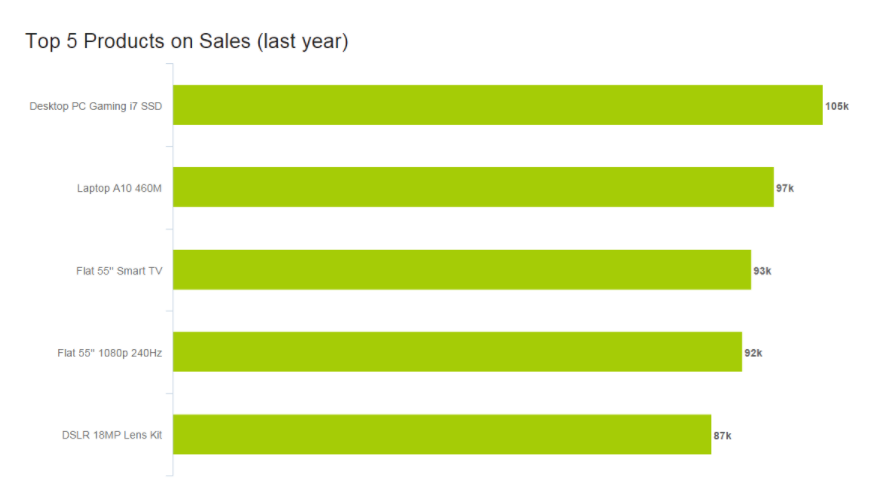
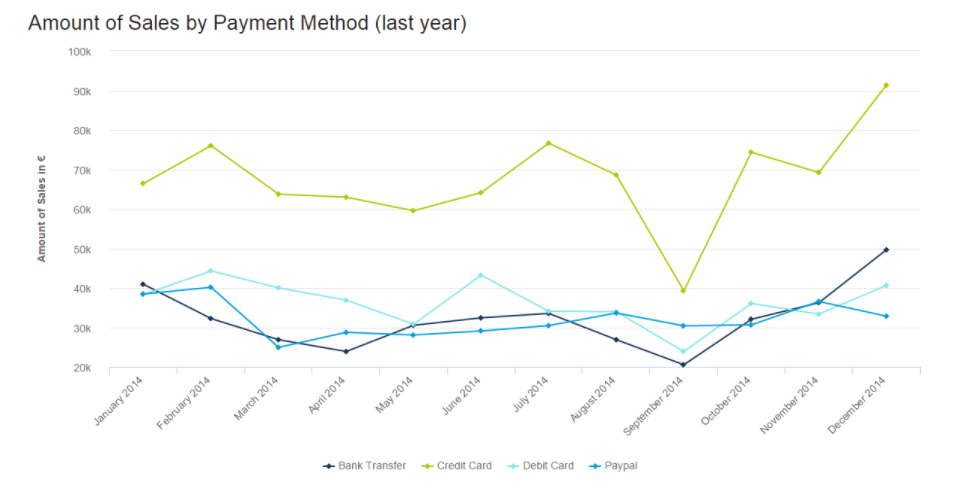
Insightful data visualizations can be used to compare numbers. These data visualizations can portray data in various different ways that will compare numbers. Line charts can be used to present data and show how data is similar or different. This kind of chart tends to be easier to view as long as there are not too many lines on the chart. Lastly, line charts are a good way to compare numbers because they show trends, accelerations or decelerations. Horizontal bar graphs can be a good way to present and compare numbers. They provide a nice visual and as long as the data is in order, they are perfect for comparing.