I was usually proud about my health. So, I felt relaxed to visit this website. Visualizing Health was a project of the Robert Wood Johnson Foundation and the University of Michigan Center for Health Communications Research. My belief was increased after reading this information.
What I was waiting for not take VizHealth adventure? It was not useless for me to make better decision for my health despite its disclaimer. 6 of candies was not 10, but they were better than nothing, they were not? Also, I could enjoy the knowledge of data visualization in health field.
The authors of website promise that there would be a real- world story to help me to understand how my images would be adapted by visualization. But what should I do to limit my images within so much images in its gallery. Yes, a “wizard tool” was available for me to use, as well as risk calculator.
I started with wizard tool by answer some questions
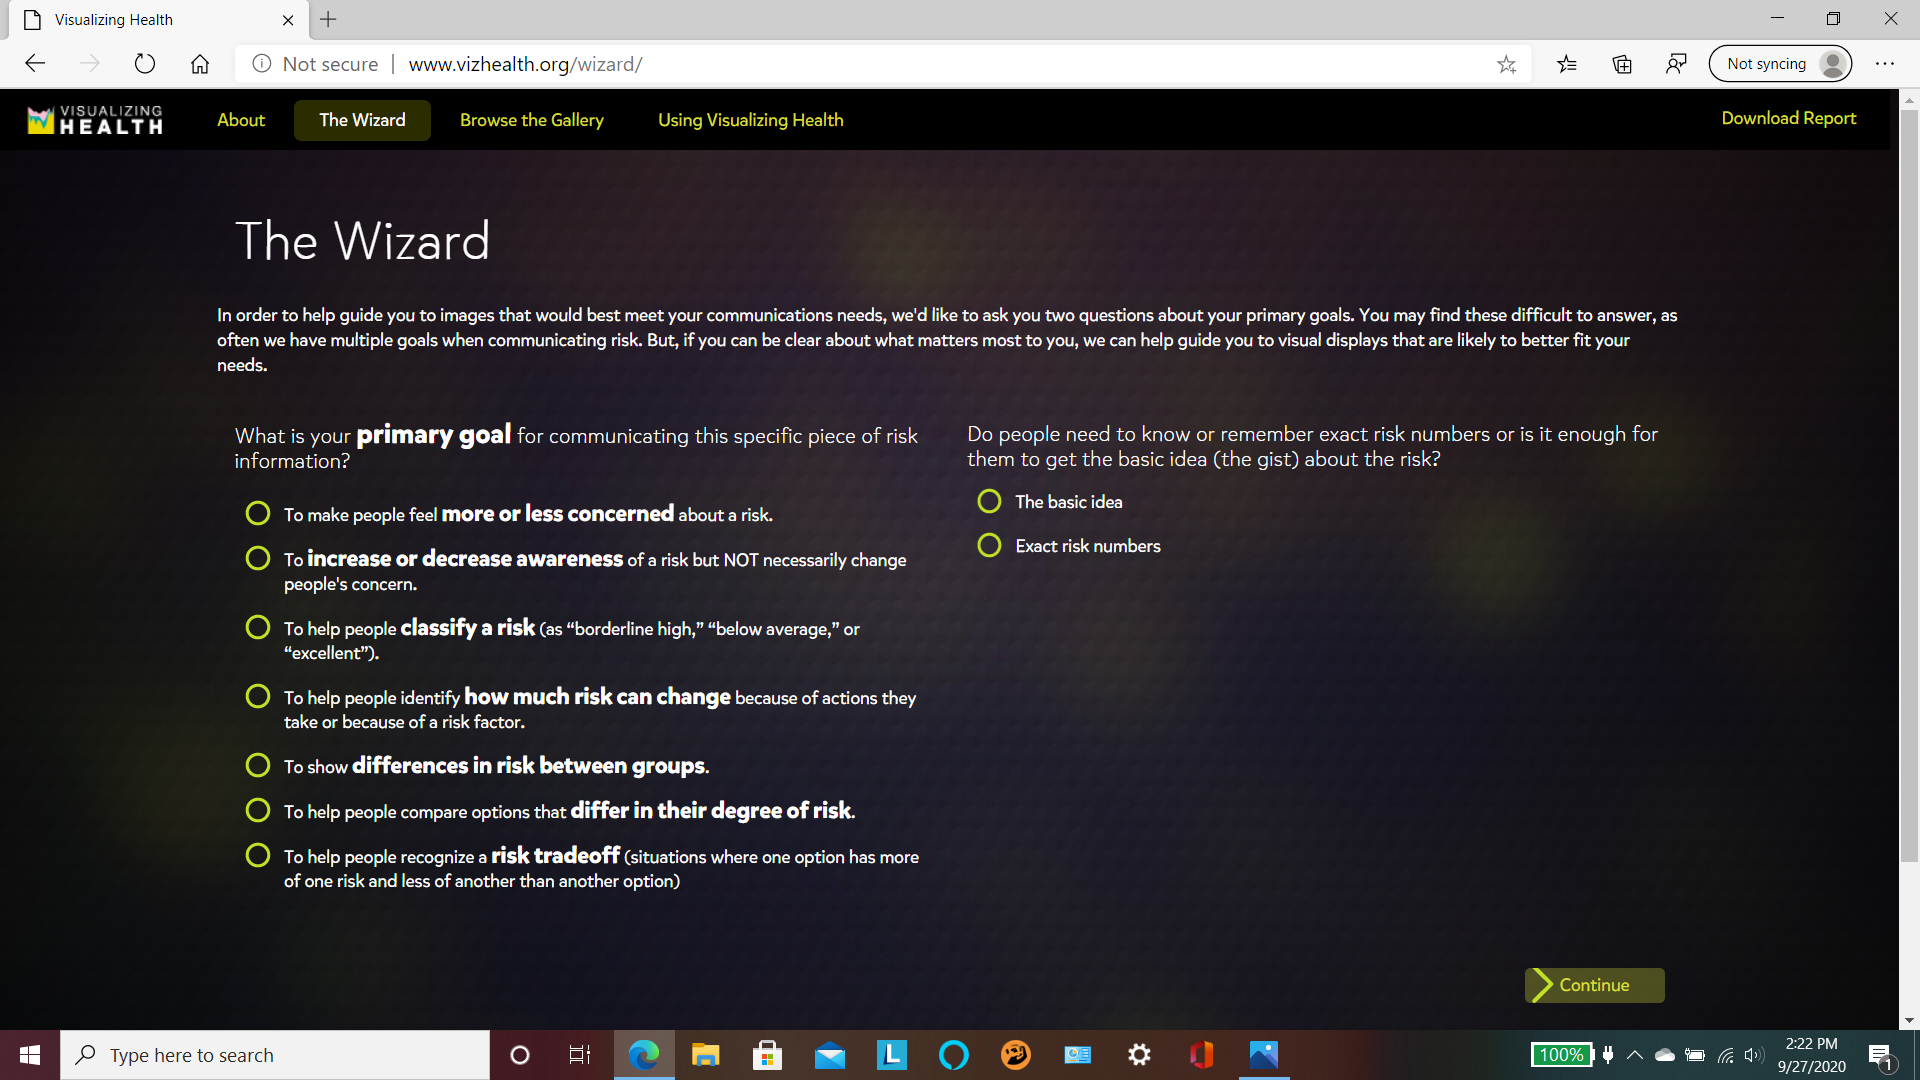
Ok, the result were here. It was helpful for me to narrow my images by selections of ” My goals, Details or gist, Data I have, Health conditions, and Graphic type” . Two first selections were results from taking Wizard.
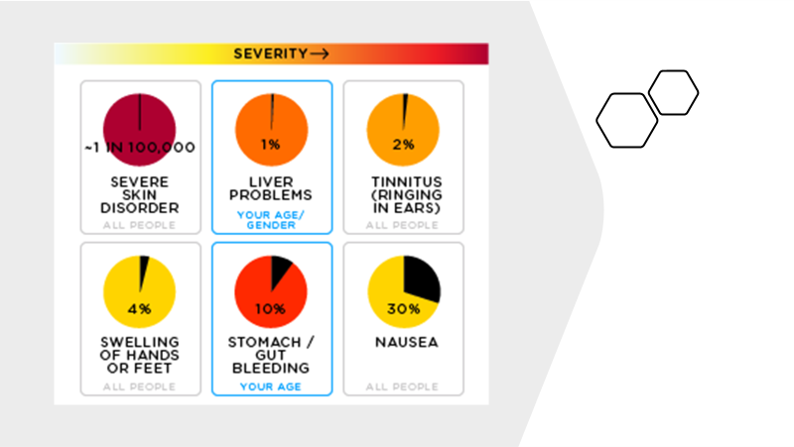
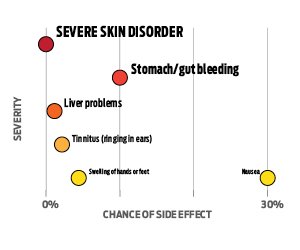
Next, I smiled to choose a specific type of graph for displaying my result. Otherwise, I could enter a matrix of health images? Could you have 11 your lovers at the same time? I only chose 1 lover and some friends. I was busy.

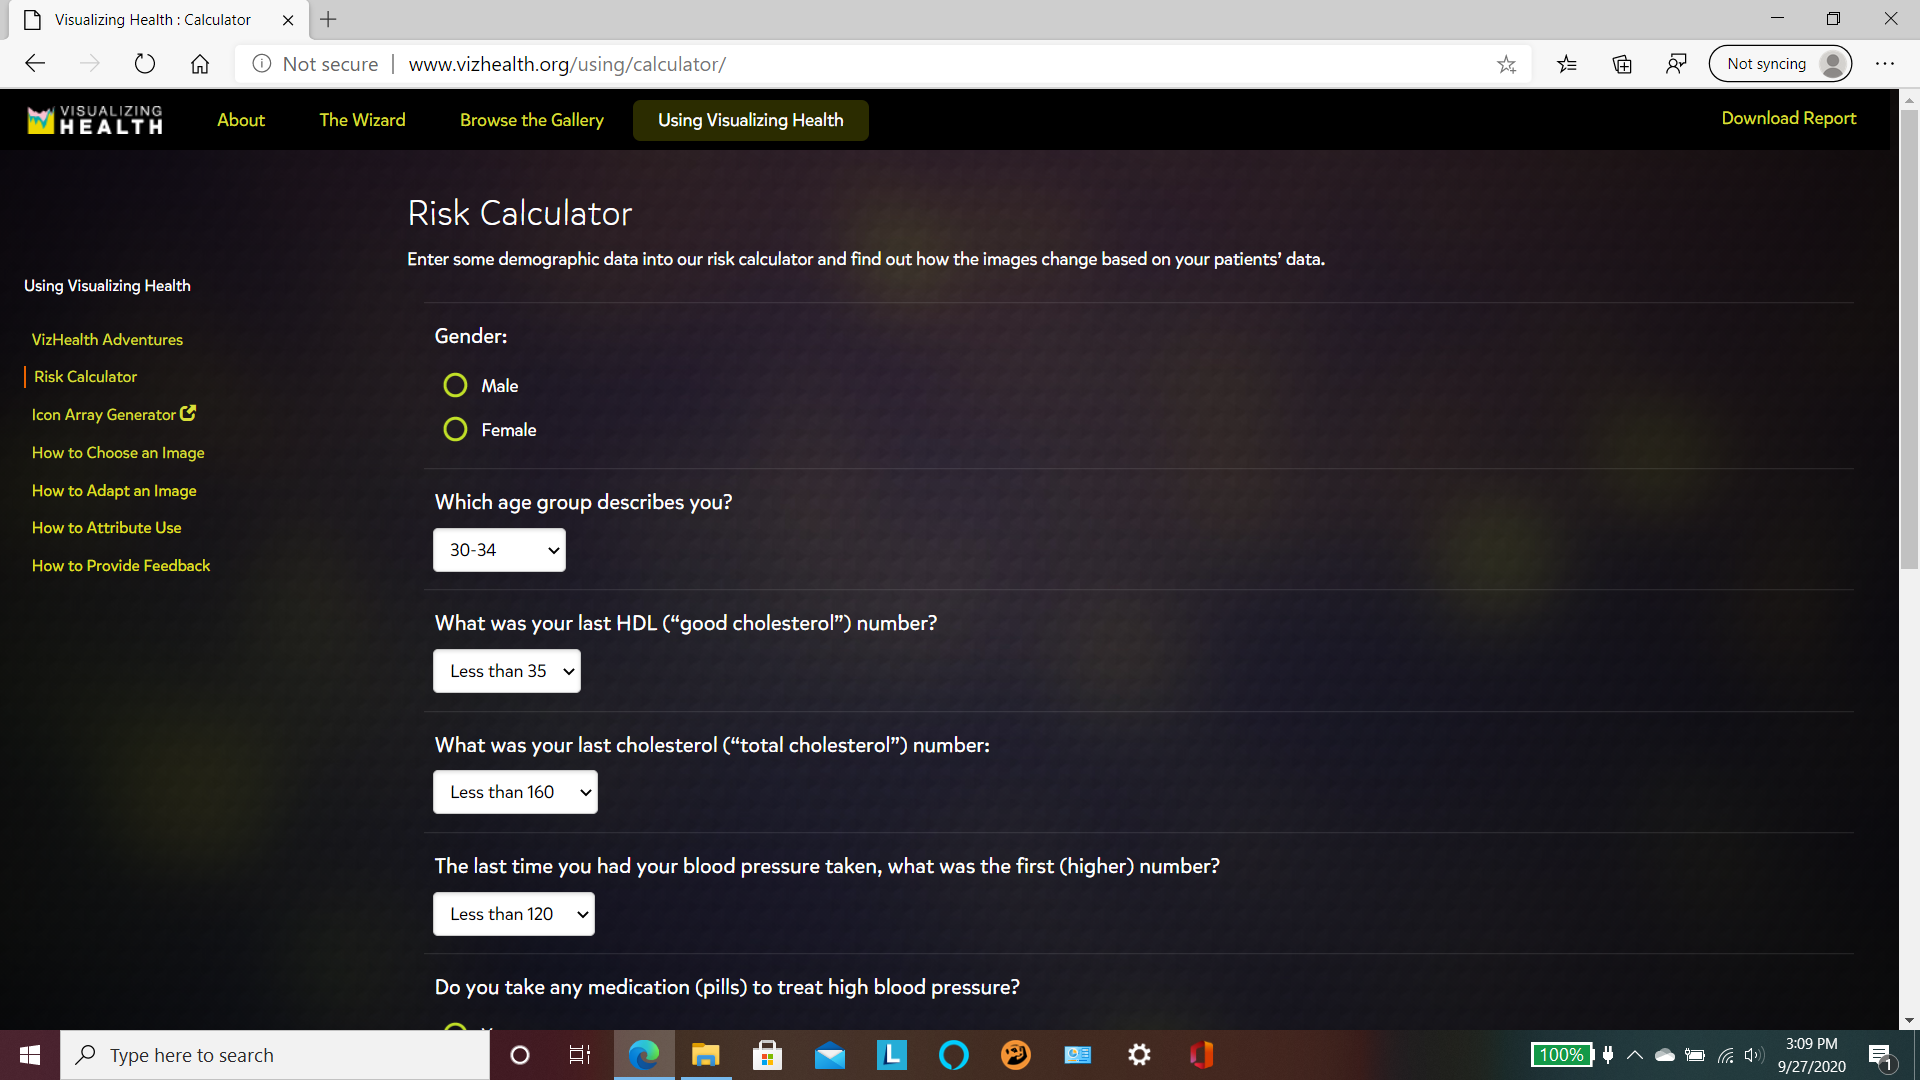
Ok, Let’s started with calculate my risk !
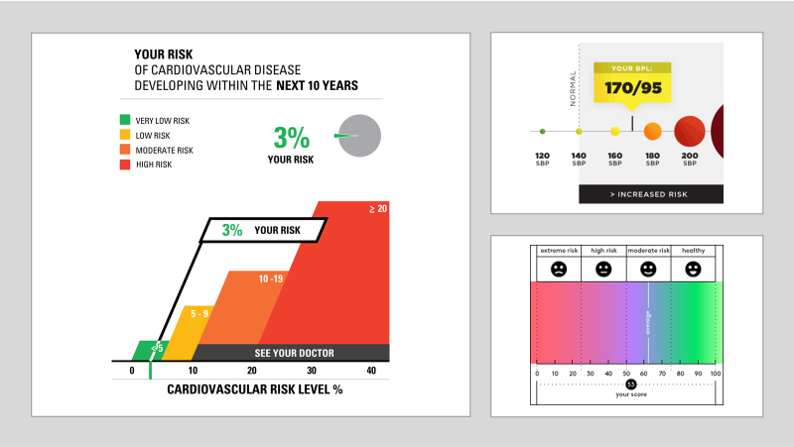
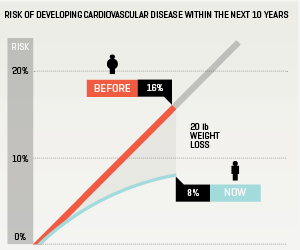
After that, I had my Cardiovascular risk level, the score of Health Risk Assessments ( HRA), as well as the translating test results into risk. Unlike secret data, I were available to share with all you. It were looked like…
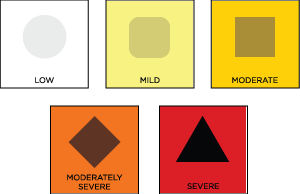
Did you agree with me that it was important to access our health risk? It was not less useful to understand about health risk factor such as gen, gender, age, health condition, as well as living and working environment. So, the website remined me about attention for variety … These images were looked like…
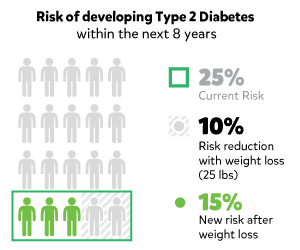
The benefit of risk reduction and the benefit of positive change were also pointed. These images are looked like…, but not mine…
Some recommendations about treatment choice, specially for color cancer or diabetes were available. But not me… I was Ok!
Finally, I made decision not to visit doctor due to my health…!

More thinking…! 09/28/2020…
I would like to thank authors of the website and my instructor for this opportunity. It is not easy to make ideas about health visualization without their health knowledge and talent, specially their creativeness, organizational and computer skills. The images / infographics are lovely and understandable.
More ever, I was inspired to learn more some health knowledge while answering some questions, as well as how to make these lovely images/ infographics. Also, I got a little experience to determine where is starting point for a difficult math problem.
Thank you!