A Pivot Table is one of the basic data analysis tools. It is a summary of your data. Pivot Tables can help answer many important business-related questions. They are used to pass information.
A Pivot Table can:
- group items/records/rows into categories
- count the number of items in each category,
- sum the items value
- or compute average, find minimal or maximal value etc.
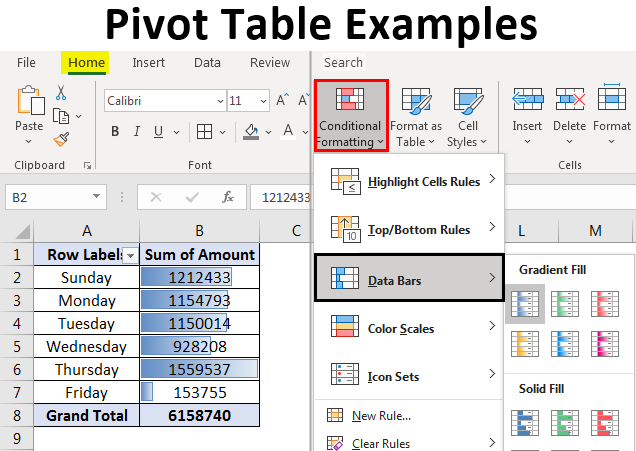
Above is another example of a Pivot Table. This table organizes the data and groups and sorts the information in a way that makes it easier to read. A Pivot Table was a good choice for this data.