A pivot table is a tool that allows creators to summarize, organize, and sort (by sums, averages, etc) their data sets. Pivot tables are simple to create and allows creators to manipulate what exactly the chart focuses on. A few examples, I found during research, shows the different uses as well as highlight how the table makes comprehension of data go much smoother.

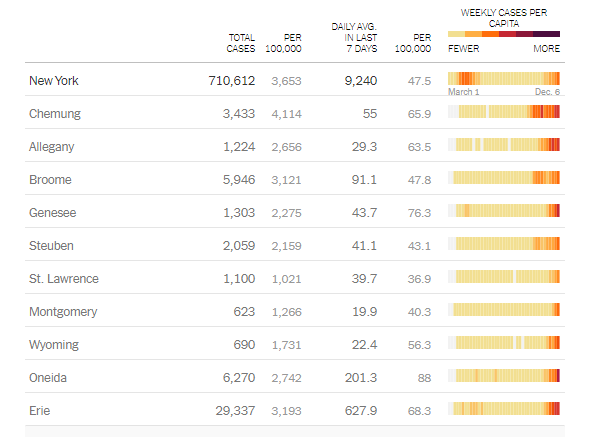
The above pivot table was an example I found that was updated in real-time and created by the New York government to keep residents updated on the amount and averages related to Covid-19 deaths. It is well organized and listed by individual counties throughout the state.

A much smaller but straight to the point pivot table I found on the inquires website highlights the average income graduates receiving after attending Wharton college. It shows slight changes between the comparison years but puts emphasis on starting salaries. The intended purpose of this table was more for persuasion on why students shoule attend this institution.

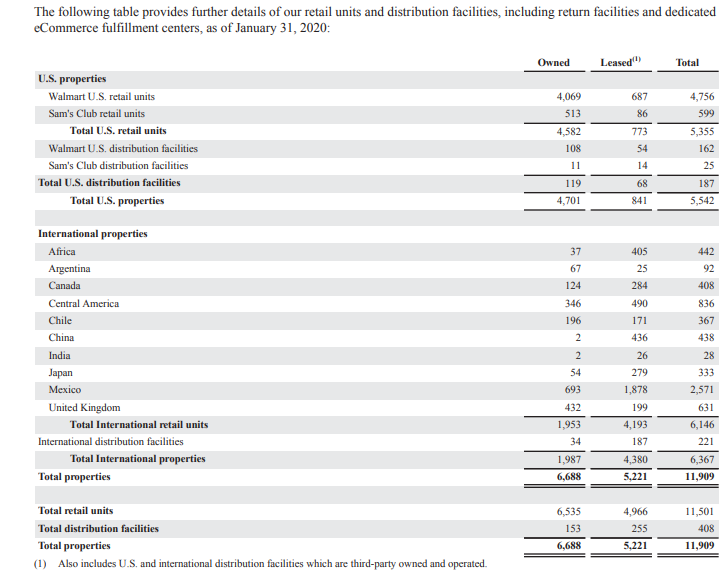
Another use I found for a pivot table was an annual report of business earnings and spending. Large corporations, such as Walmart release annual data for public analysis. The use of the pivot table above makes the data easier to understand and follow. This particular chart highlights the properties worldwide owned by the Walmart Corporation.
Pivot tables have a larger variety of uses because the table can be manipulated to place emphasis on specific areas. Here is a beginners guide to creating and using pivot tables.