A pivot table is a great way to show the summary of your data. It is really useful if you have information or data that can be put and interpreted by groups or sums of groups.
Pivot tables allow large information that is in excel to be simplified. A lot of people shy away from excel ,like myself, because the information can look and seem very. overwhelming. Putting the information into a pivot table allows simplicity.

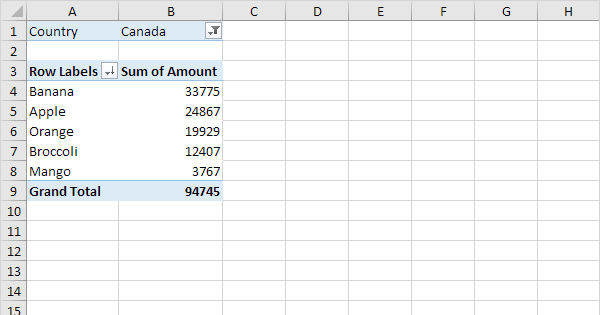
Pivot tables are an easy way to track trends. For example, the image above shows a trend by state of clothing items sold. You can do a pivot table for just about anything but I think it makes the most sense to do it for large data only.