What is a pivot table?
A pivot table is a tool in Excel that allows users to interact with their large, raw dataset to gain a better understanding of specific topics within the dataset.
When is a pivot table useful?
Pivot tables are extremely useful when dealing with any dataset that contains a vast amount of variables. Additionally, they are useful in cases where you are looking to identify specific variables within the dataset and how they interact with other variables within the same dataset.
Examples of pivot tables:
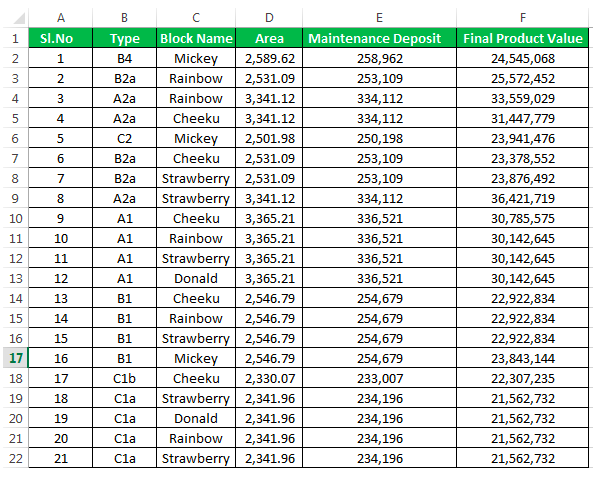
Pictured below is an example of a raw dataset which can be found here. While this is not the entire dataset you can begin to see that if this contained hundreds of rows this could be confusing to look at and would need to be formatted in a better way.

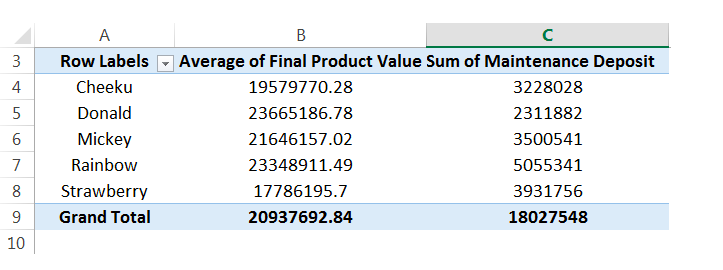
That is where the pivot table comes in! From the raw data we can then select specific variables to look at and compare to other variables in the same dataset. Below you see one example of a pivot table that was created using the raw dataset above. You see in this table only the block names, final average of product & sum of maintenance deposit are shown.

Pivot tables make it extremely easy to simplify your large and overwhelming data sets into clean and clear tables. Pivot tables can be used in almost any instance where there is statistical values being computed such as sums or averages.