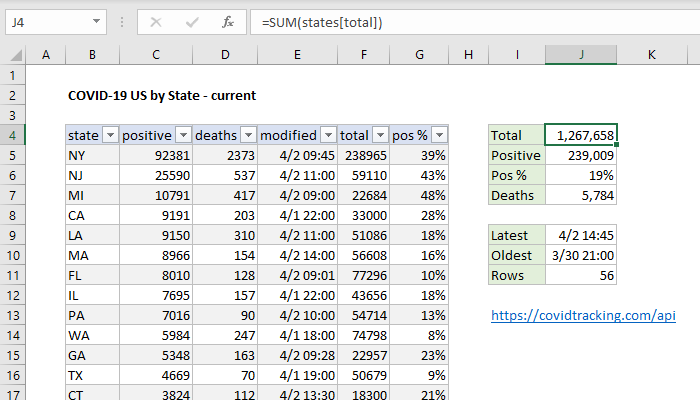
If you have an abundance of information in diffrent catagories that you need to show. Then the pivot table is the way to go. A PivotTable is a powerful tool to calculate, summarize, and analyze data that lets you see comparisons, patterns, and trends in your data. One perfect case to use a pivot table is the data from the Corona Virus. With Covid-19 affecting so many people around the world, the statstics are huge and can be confusing. Luckily, a pivot table can easily express this data as seen in the example below!