Pivot Tables are best described as summary tables because they display the most important information the researcher, company, or student is trying to represent. They are typically easy to create and are a very organized way to record numerical data. Below are a couple examples of how Pivot Tables are used.
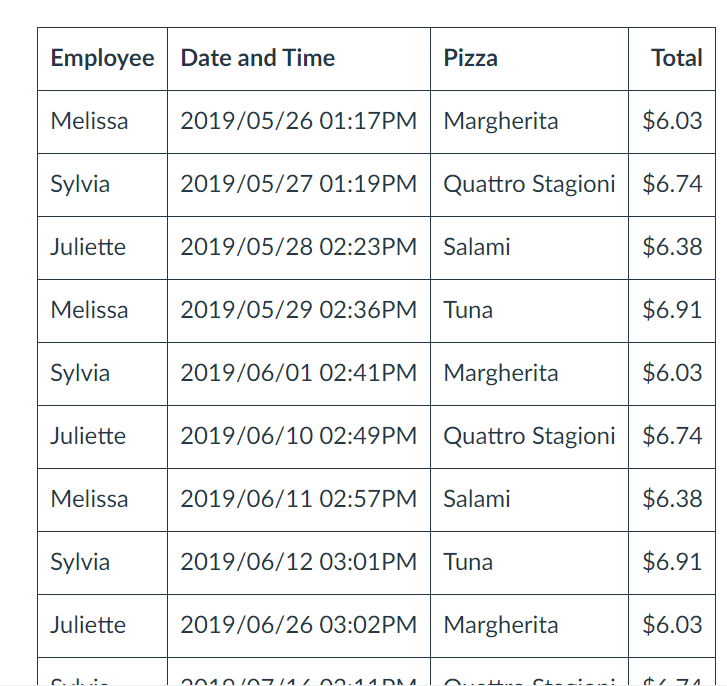
One way Pivot Tables can be helpful is when tracking receipts. As you can see, the table is very neat and organized. The data is laid out in such a way that is easy to read.
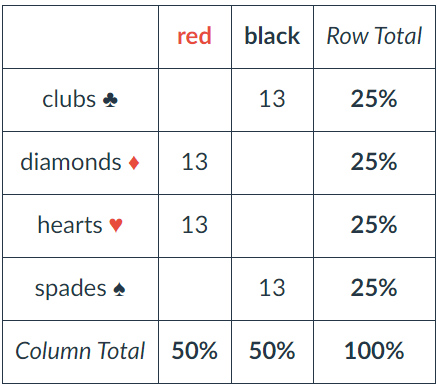
The deck of cards can be divided into symbols, numbers, and colors. From here, each column and row are totaled to make the information easier for the reader to understand.
Conclusion
There are many more examples out there such as insurance companies and restaurants. However, in all these examples Pivot Tables are always grouped items, records, and/or rows into categories and they count the number of items in each category.