Energy consumption is a major issue in the United States that spans across multiple topics, from the oil industry’s environmental impact to the debate over alternative sources such as nuclear power and hydro dams. Yet, most Americans are largely unaware of how much energy gets consumed daily, focusing more on where the energy comes from.

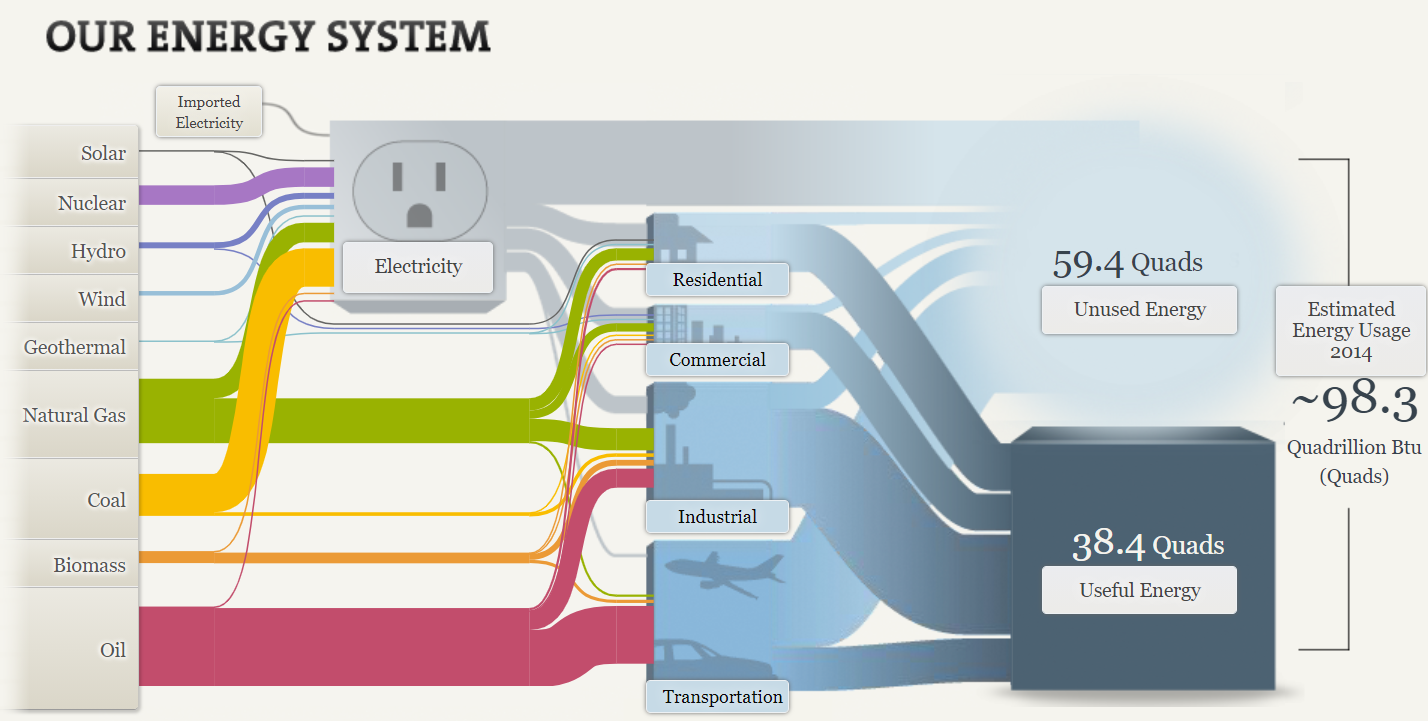
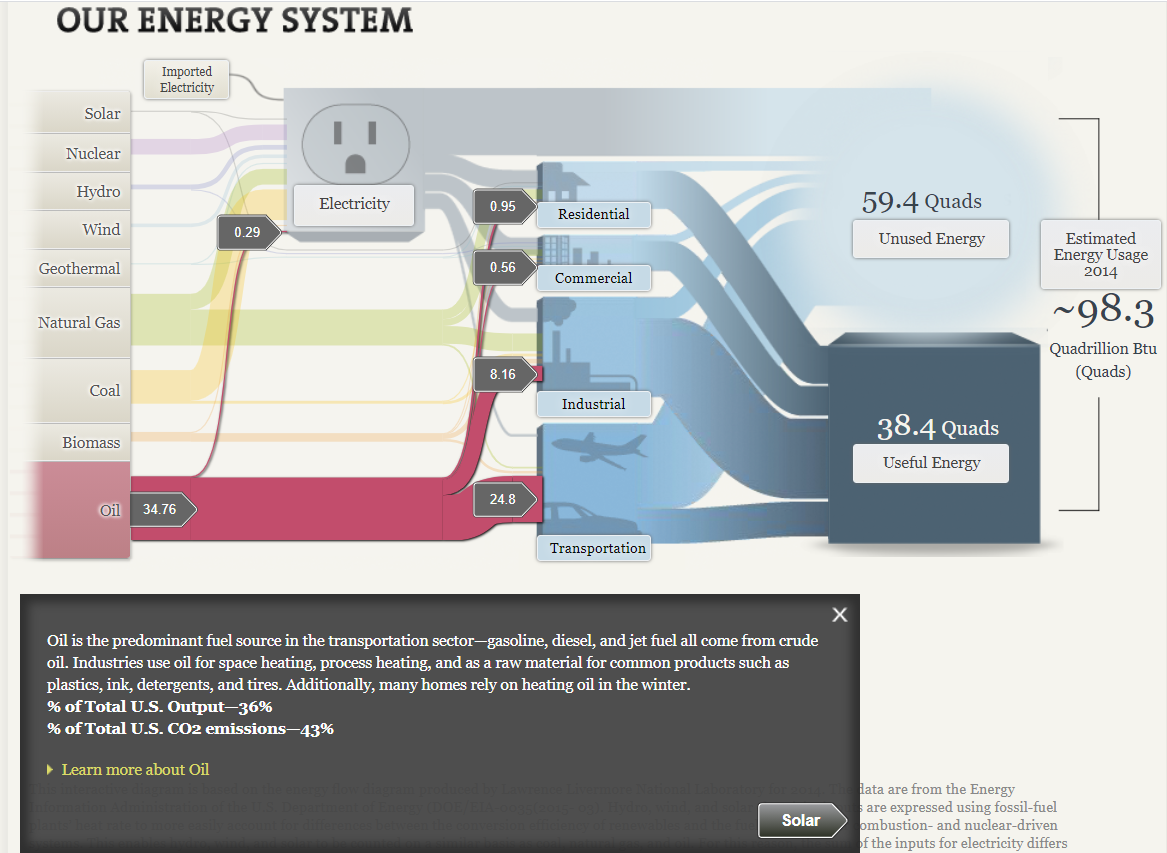
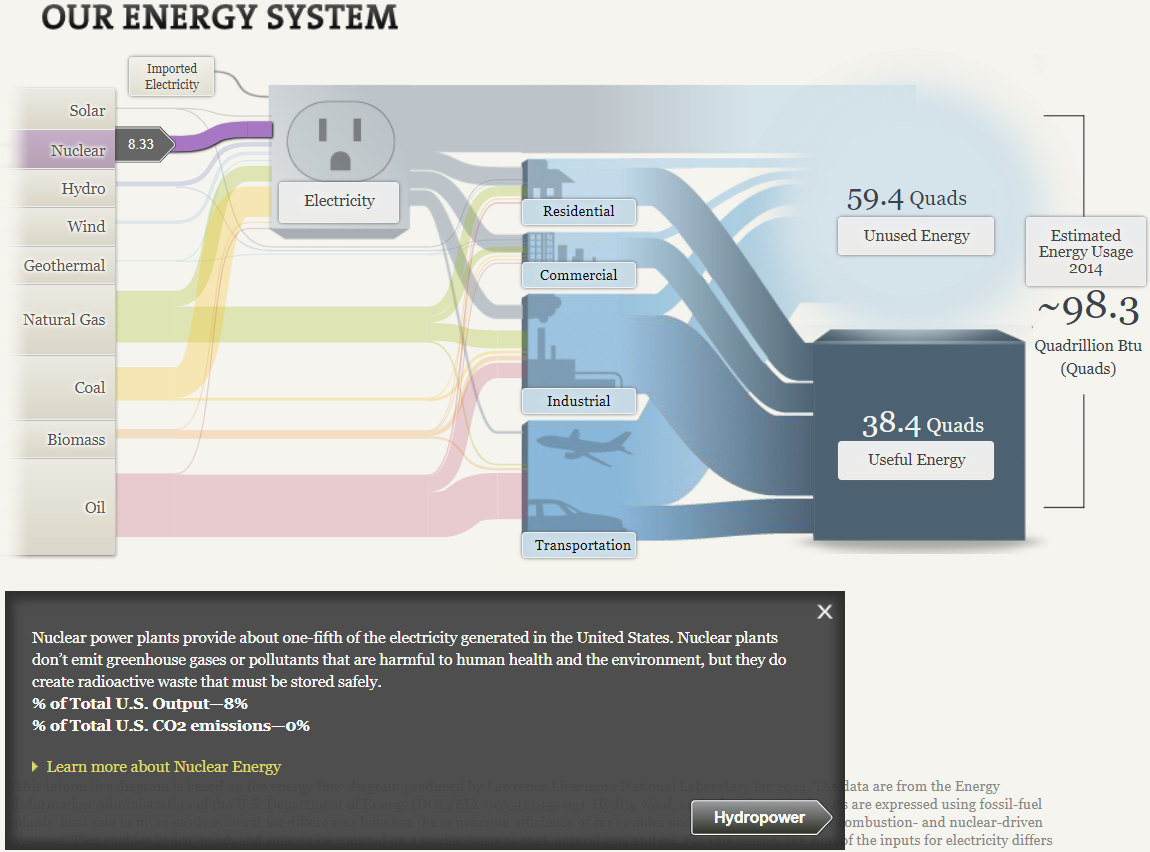
The National Academies of Science, Engineering, and Medicine compiled a Sankey chart depicting America’s energy usage in 2014. Much to my surprise, about 60 percent, or 59.4 quads, of generated energy went unused. Clicking on each point in the Sankey chart brings up a tooltip containing details about each source and how much energy gets used.

Unsurprisingly, petroleum products were the largest energy source in 2014, primarily used in industry and transportation. The second and third-largest energy sources were natural gas and coal, both of which were converted into electricity to power residential homes, commercial and industrial businesses.

Nuclear energy is possibly the most controversial alternative energy source due to its implications in disaster events (Chernobyl in 1986, and Fukushima Daiichi in 2011) and the nuclear arms race. As the tooltip states, nuclear energy provided one-fifth of the nation’s electricity. While they don’t create any carbon emissions, radioactive waste from the power plants is still a health hazard. Additionally, opponents of nuclear power cite the potential for these power plants to be weaponized or targeted by terrorists if the health risks involved in handling radioactive materials aren’t enough to raise concern.
