The National Academies of Sciences, Engineering, and Medicine dedicated an interactive website to Energy and “everything you need to know”. While browsing through the well-organized web page, I found a multitude of statistics, using different visualizations from big numbers to timelines and everything in between.
Here are a few examples of different visuals throughout the website.
I was pleasantly surprised by the amount of information found throughout each section and how well they put visuals to use. Not only did the visuals keep the website intriguing but made the information clear and easy to obtain. for example:
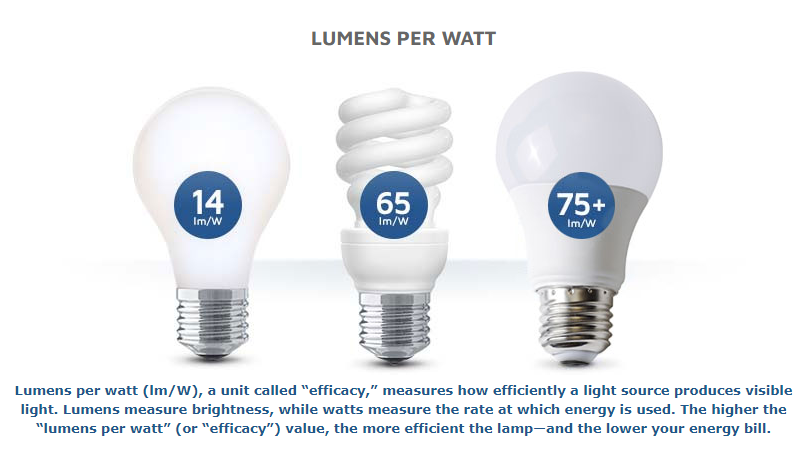
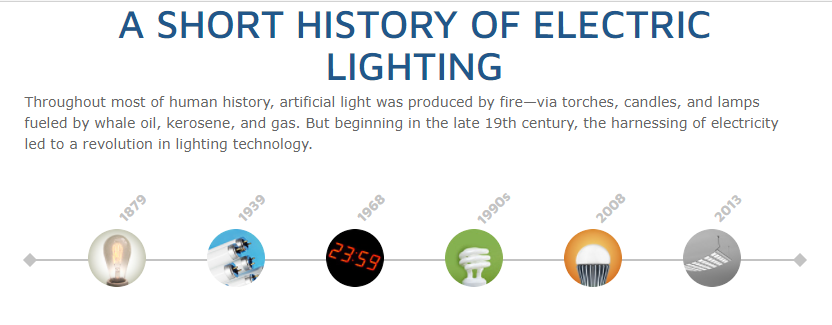
This simple visualization draws a clear connection between each variable and shows a comparison to the amount of light each produces per watt of electricity. There is little room left for misunderstanding because the visual is clearly labeled and the description helps interpret the picture. I think using pictures of each type of light bulb was smart because if this was a graph and was labeled incandescent, CFL, and LED it could lead to confusion on which lightbulb is which.
Though I was for the most part impressed with the visuals and the way the information was presented, I did find a few things I would have changed.
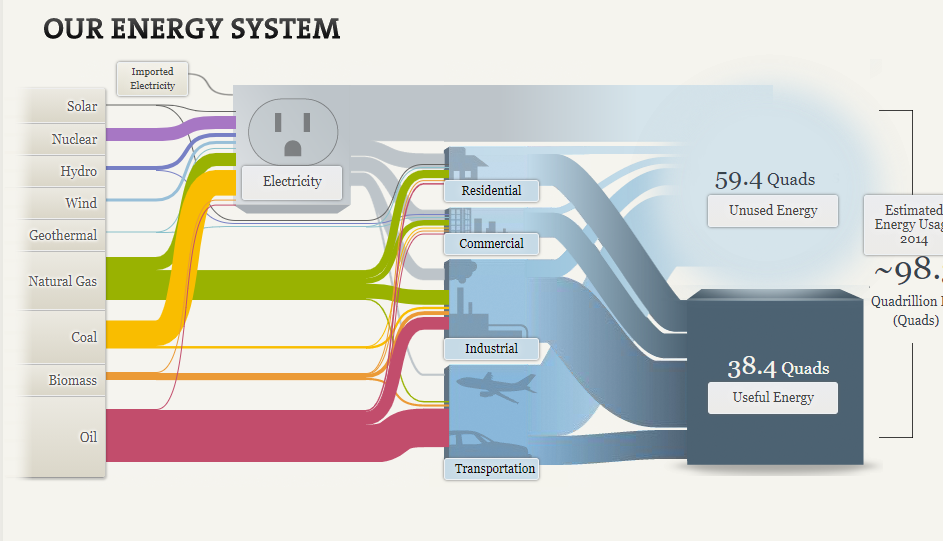
for example: BIG NUMBERS
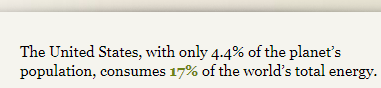
I personally think the wow factor in this statistic was hindered by the lack of emphasis on the numbers. I think they should have chosen a much bigger font to place the focus on US energy consumption.
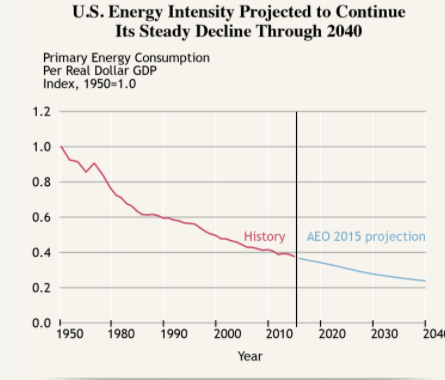
Line graph:
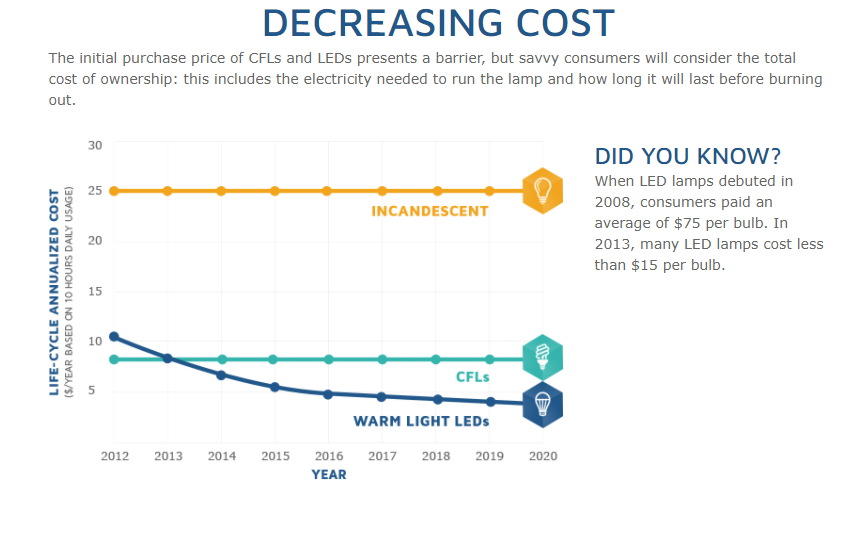
I think this graph is confusing because incandescent’s line stays consistent it gives off the impression of a benchmark line. I think at a glance without acknowledging the giving information it looks like CFLs and LEDs are falling short of a benchmark.
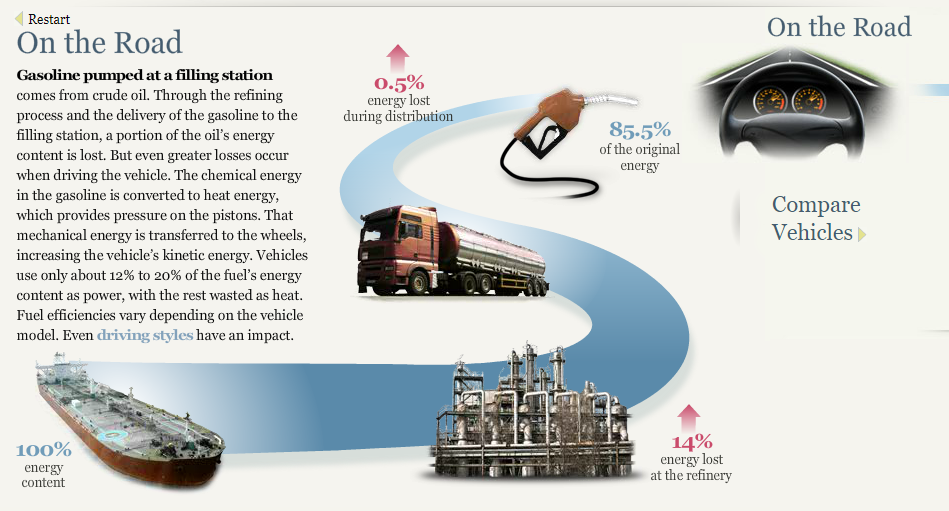
Listed Statistics
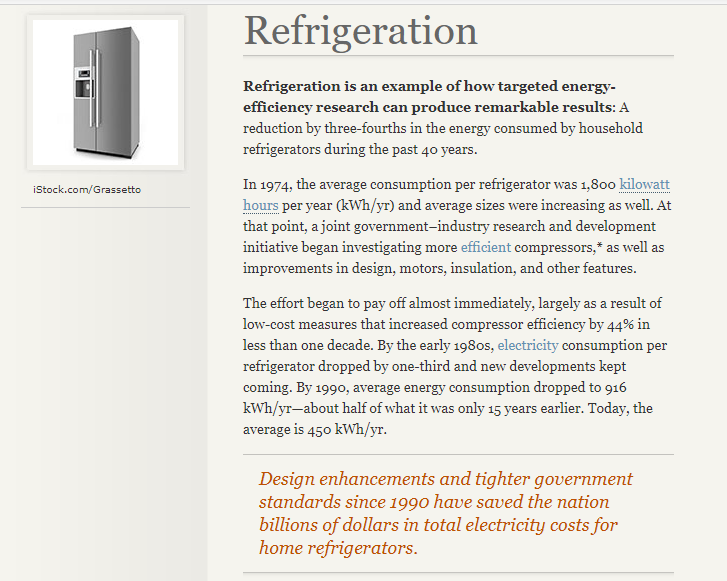
Personally, this section is just a lot of words to get lost in, when reading about the reduction of energy use in refrigeration over the years. I think that using a visualization here would keep this page more interesting and keep readers from disengaging.
Overall, I found this website to be a great resource and very knowledgeable. The visualizations were, for the most part, extremely well done and appealing.