The website of the National Academic of Sciences, Engineering, and Medicine. The source data is provided by Energy Information Administration of the U.S. Department of Energy and from its reports and studies.
Within my limited time, I tried to look for some knowledge about our energy system, as well as how the authors can tell us by visualization in 4 main parts
- How we use energy
- Our energy source
- The cost of energy
- Energy efficiency
- How we use energy
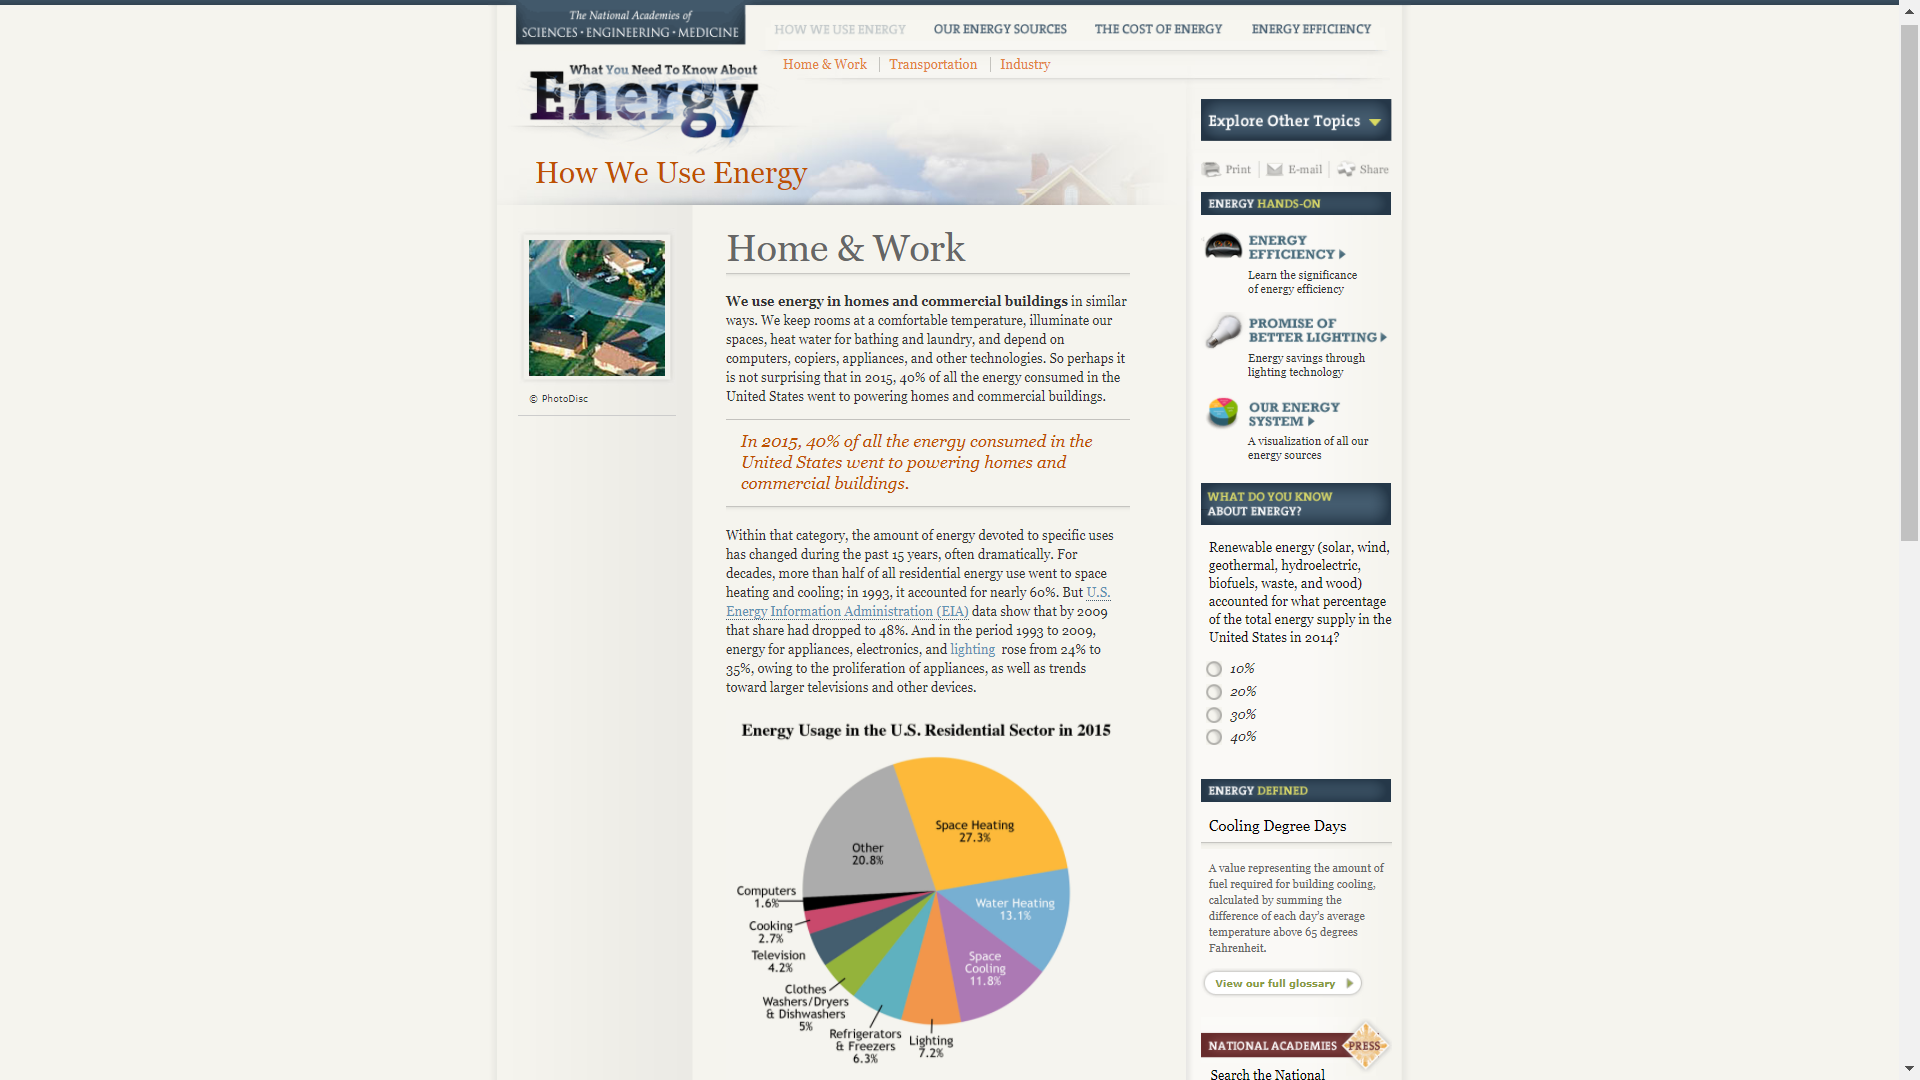
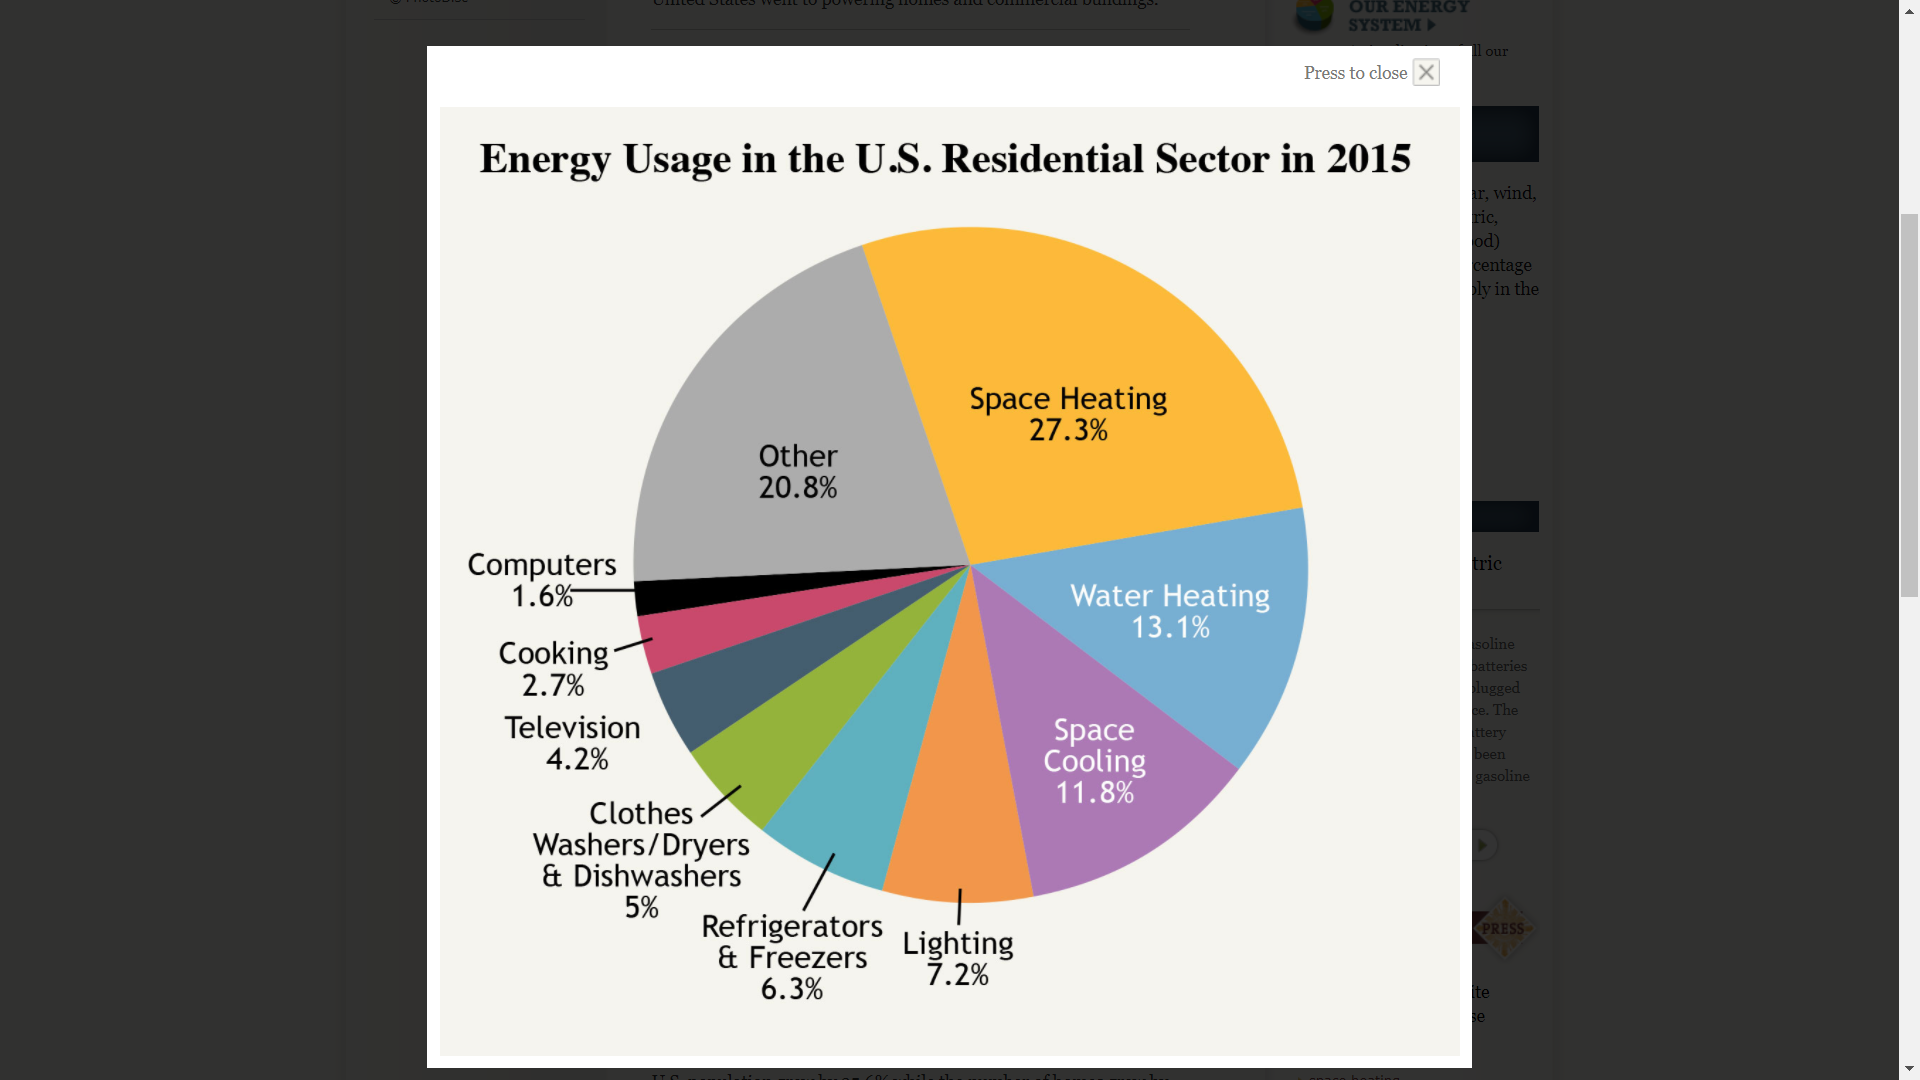
Among four economic sectors of residential, commercial, transportation, and industry; I consider ” Home & Work” that include about 40% of the energy consumed in the United States in 2015. Instead of carefully read information, it is easy for me to understand how much useful energy is in our life along full data by visualization with the pie chart. The data chart also shows the comparation of different way of consumptions in 2015. I will be more interesting to know the demand trend of different types of consumption with the line chart.
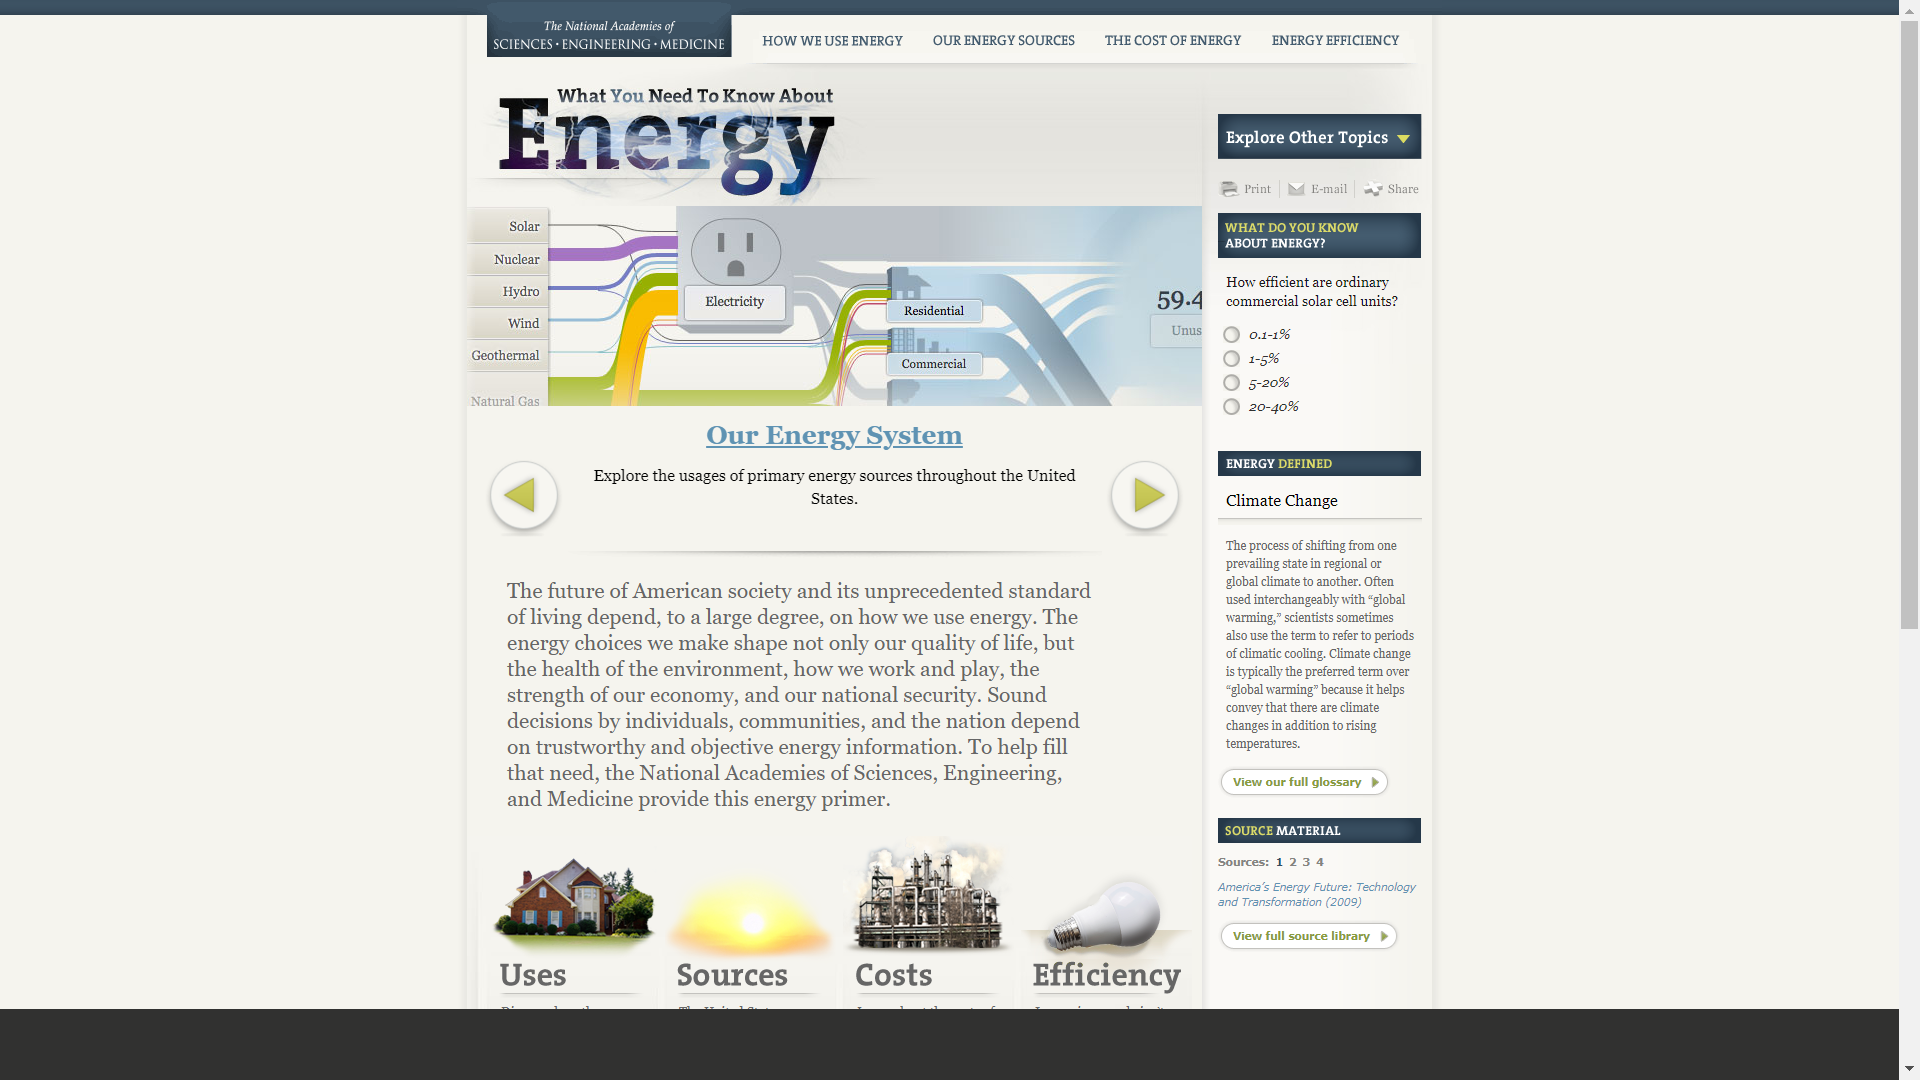
2. Our energy source
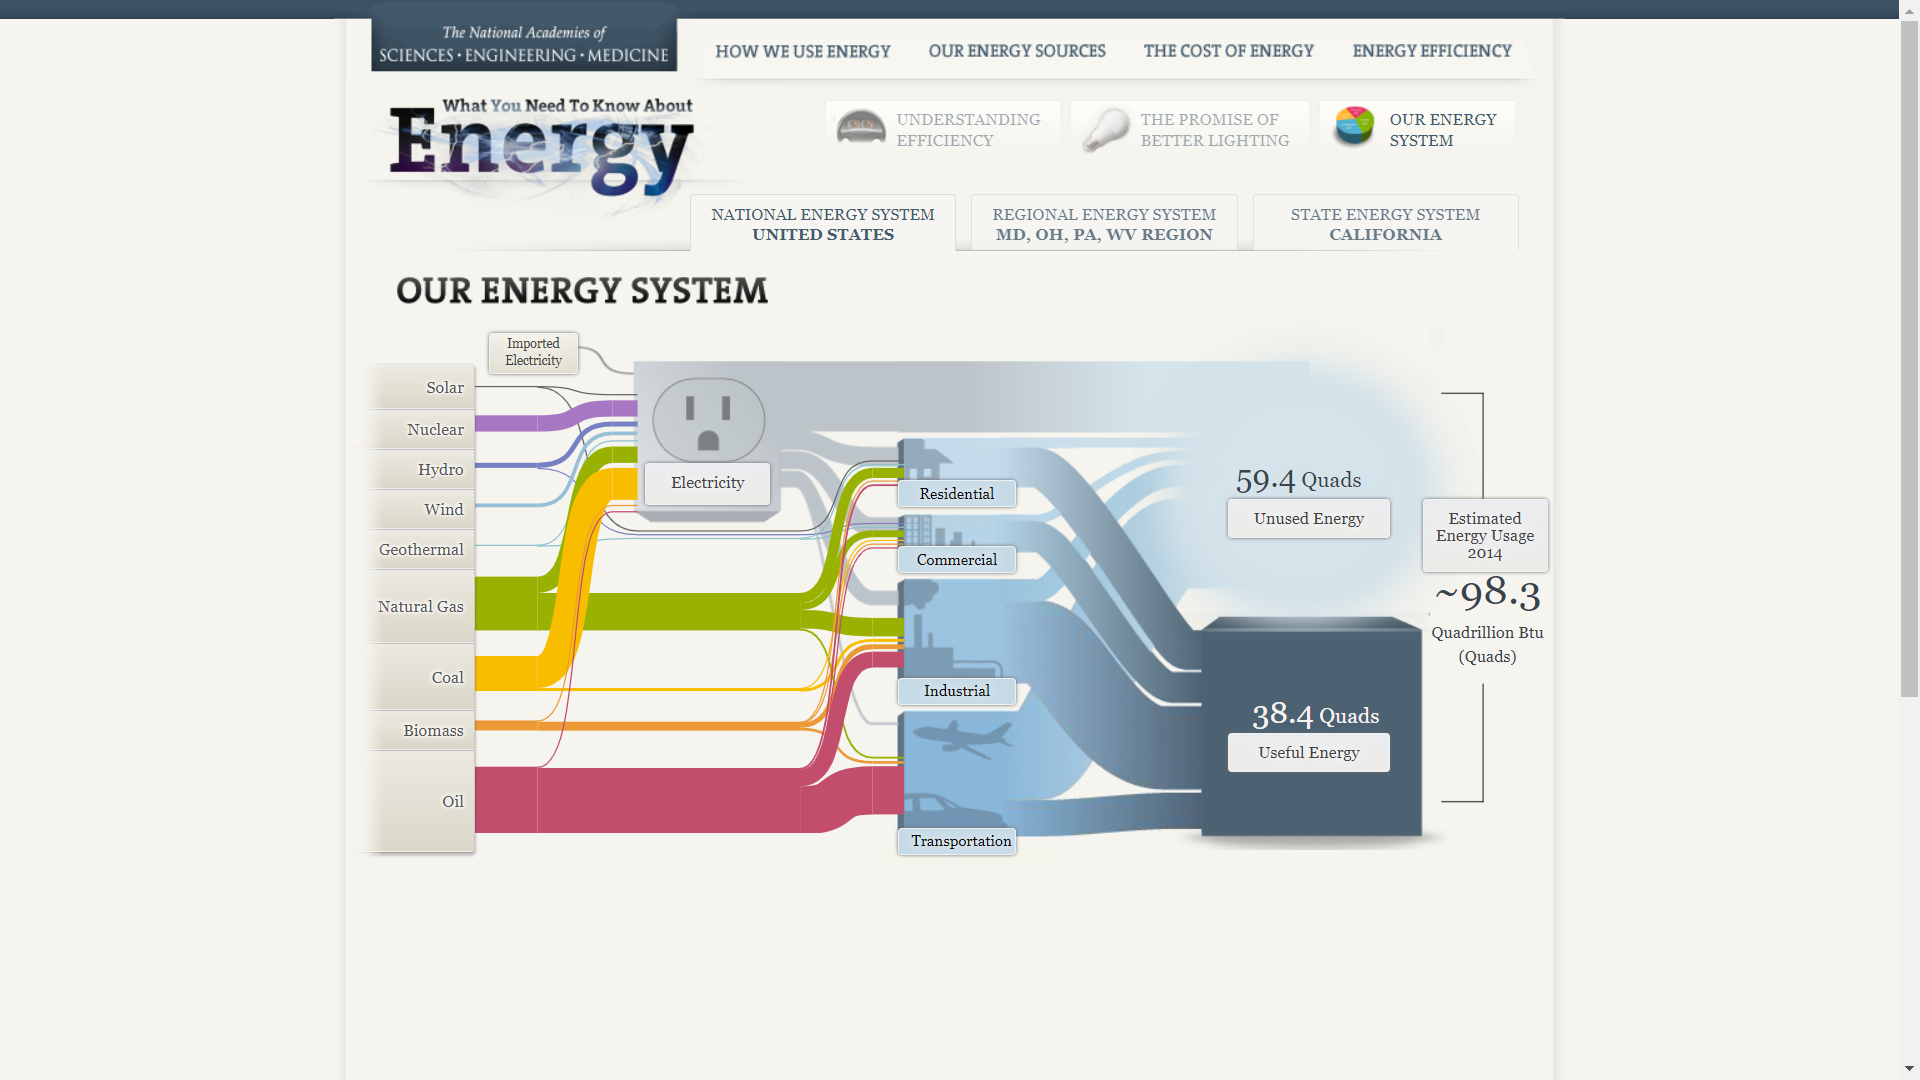
Of course, this part I am very consider. I want to know what on the hand of U.S. Energy system and its capability. Also, I like the way the authors express the direct and indirectly supply from energy sources to consumptions.
It is happy to hope we have enough affordable energy in the future. I love U.S government, because they love their people. They always take care us from how to reserve to supply enough energy for our life and every fields in U.S. They know how to invest to exploit nature energy sources in long time due to decline in other limited energy sources, as well as to look for the solution to limit the waste of energy in the process of production, supply, and consumption. On the other hand, if we significantly dependent on the energy source of other country, we can lost some favorited points in our competitive advantage position. The photograph helps me to have this pride emotion.
3. The cost of energy
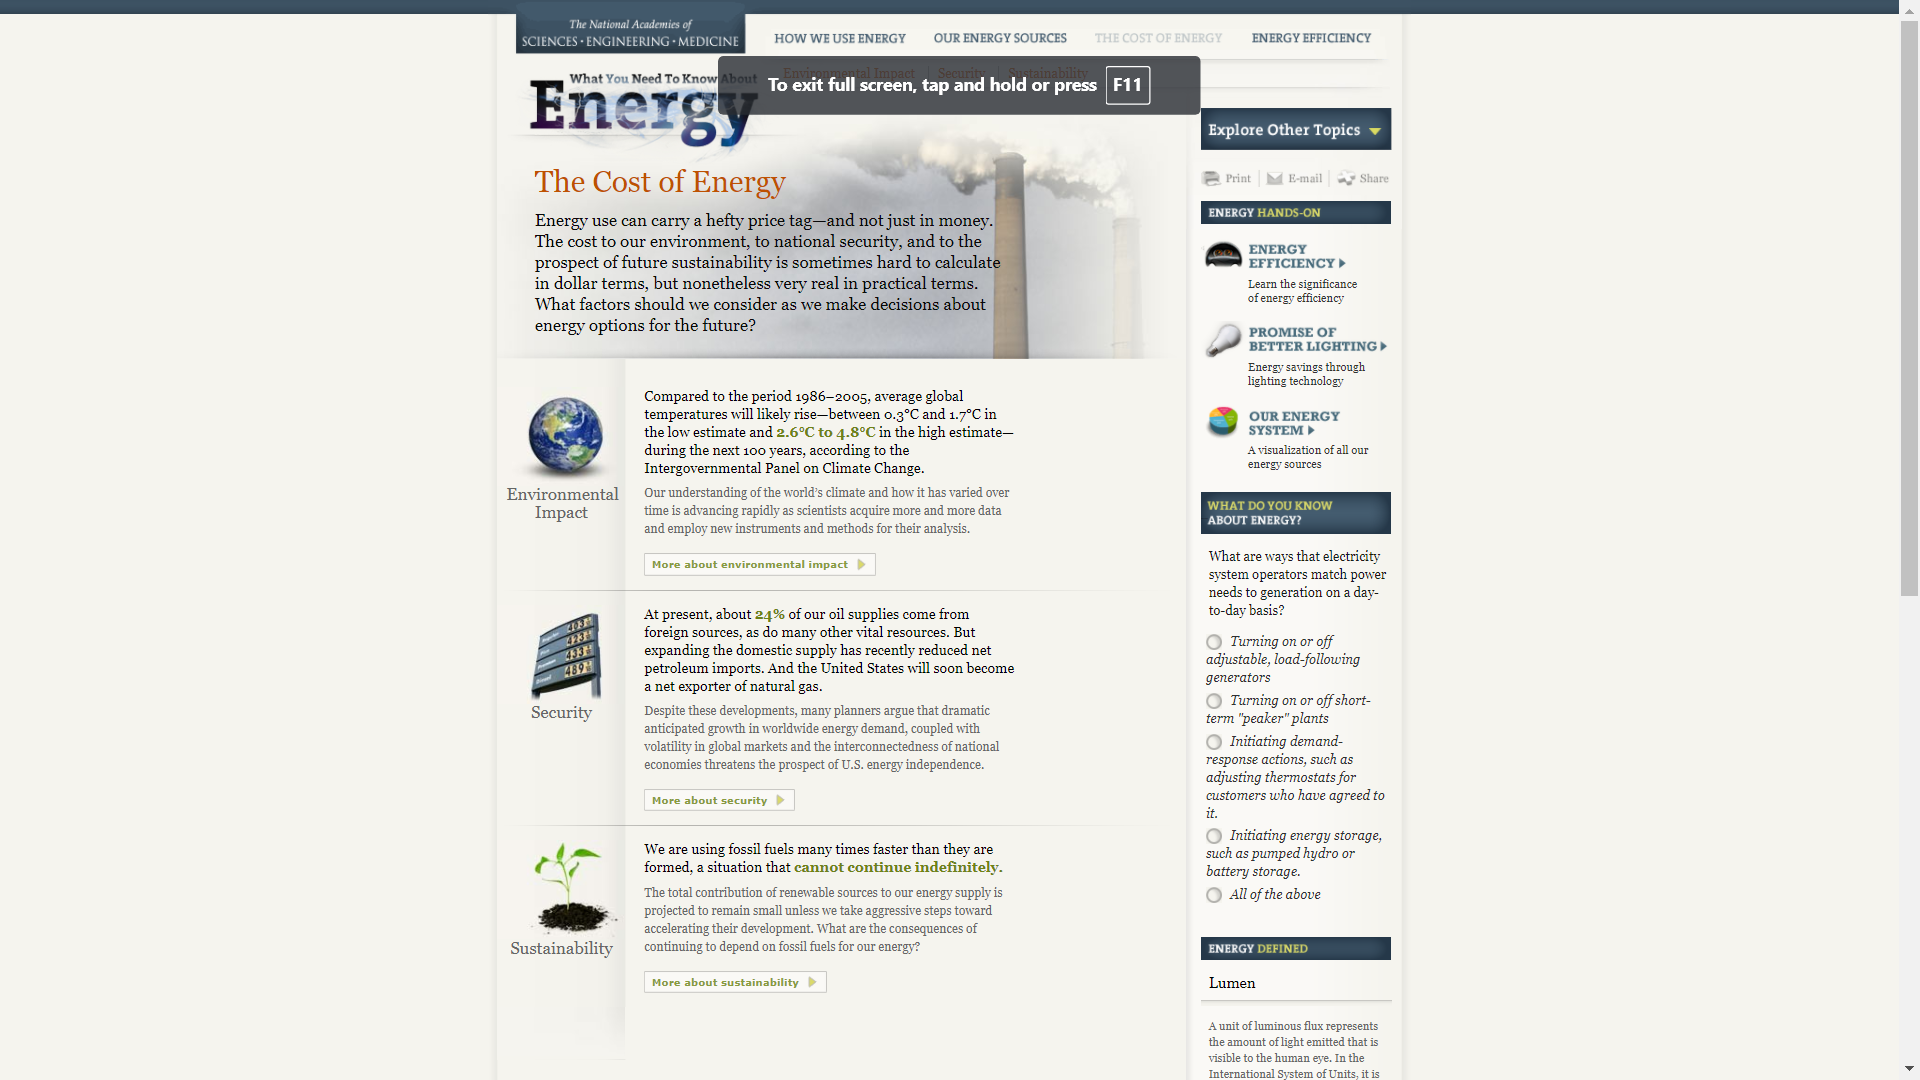
We need to consider the cost of energy, but I did not see any charts and photograph yet.
4. Energy efficiency
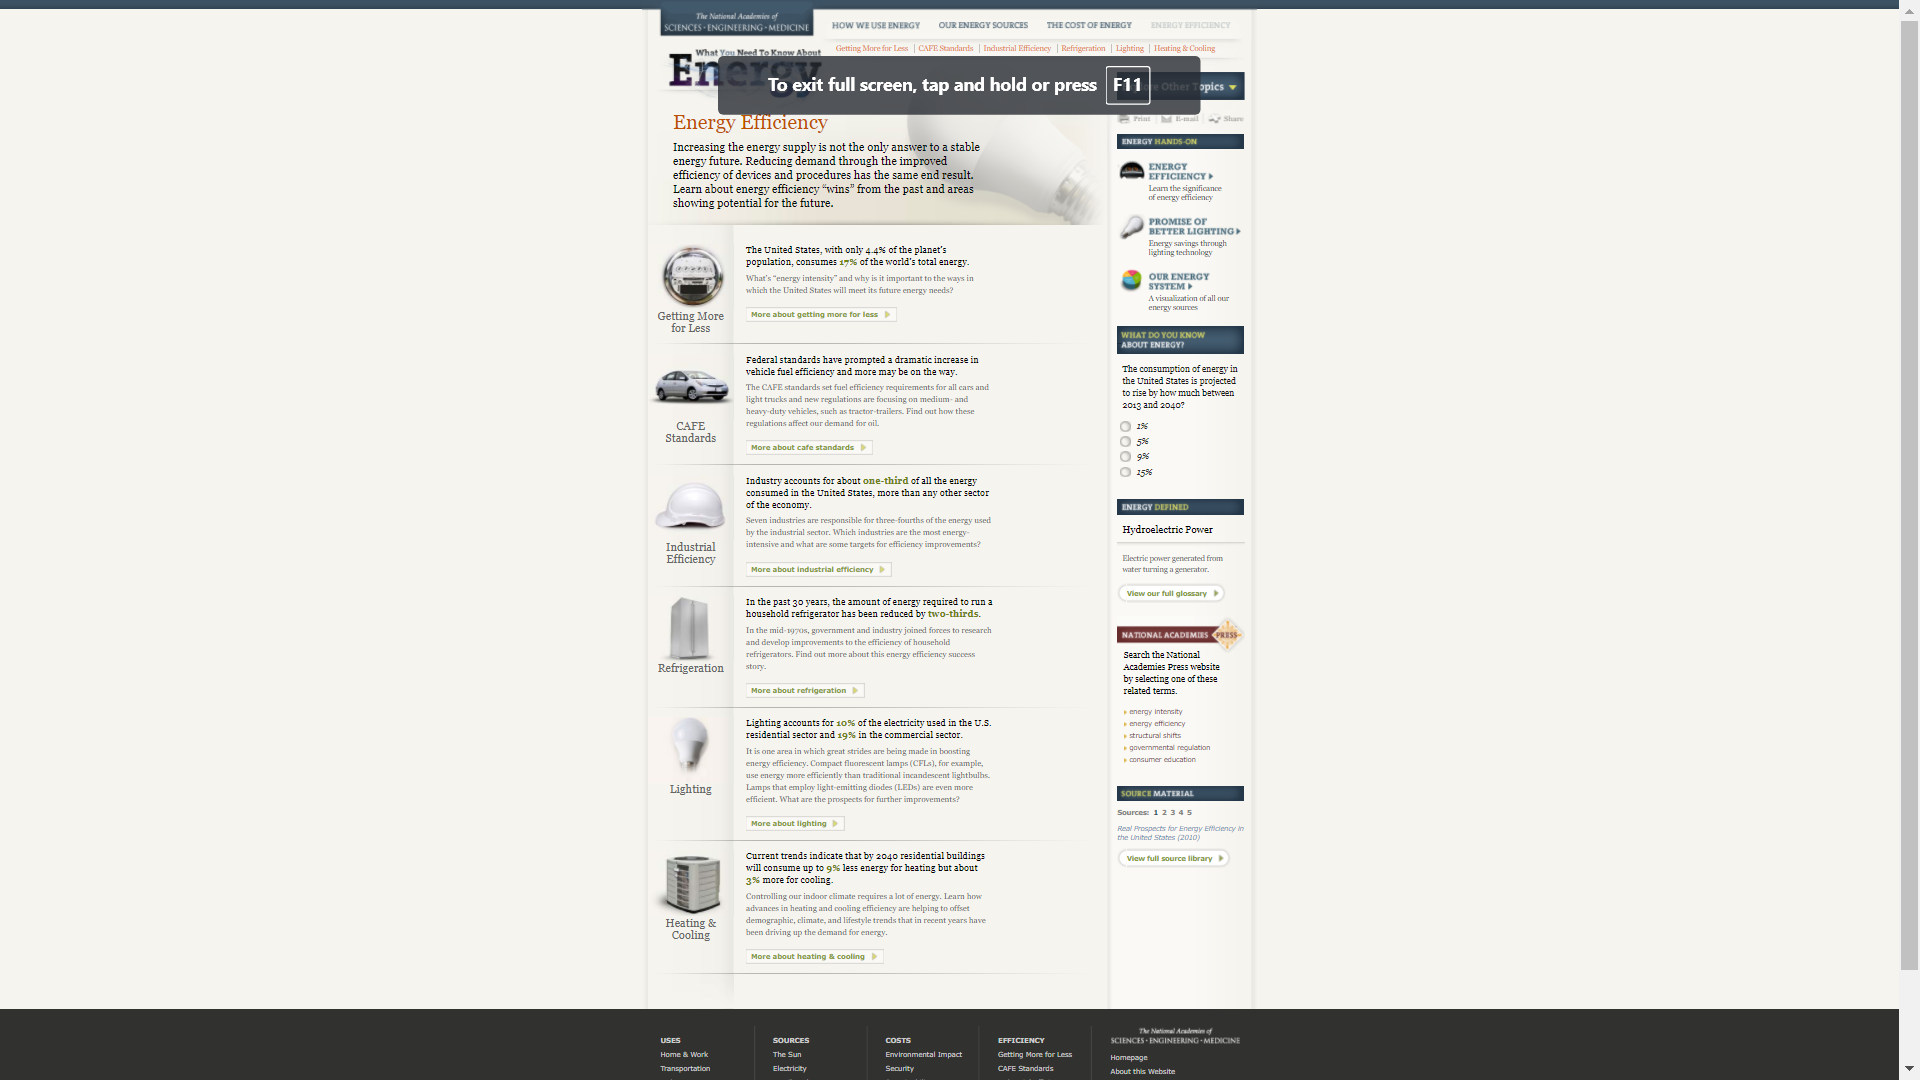
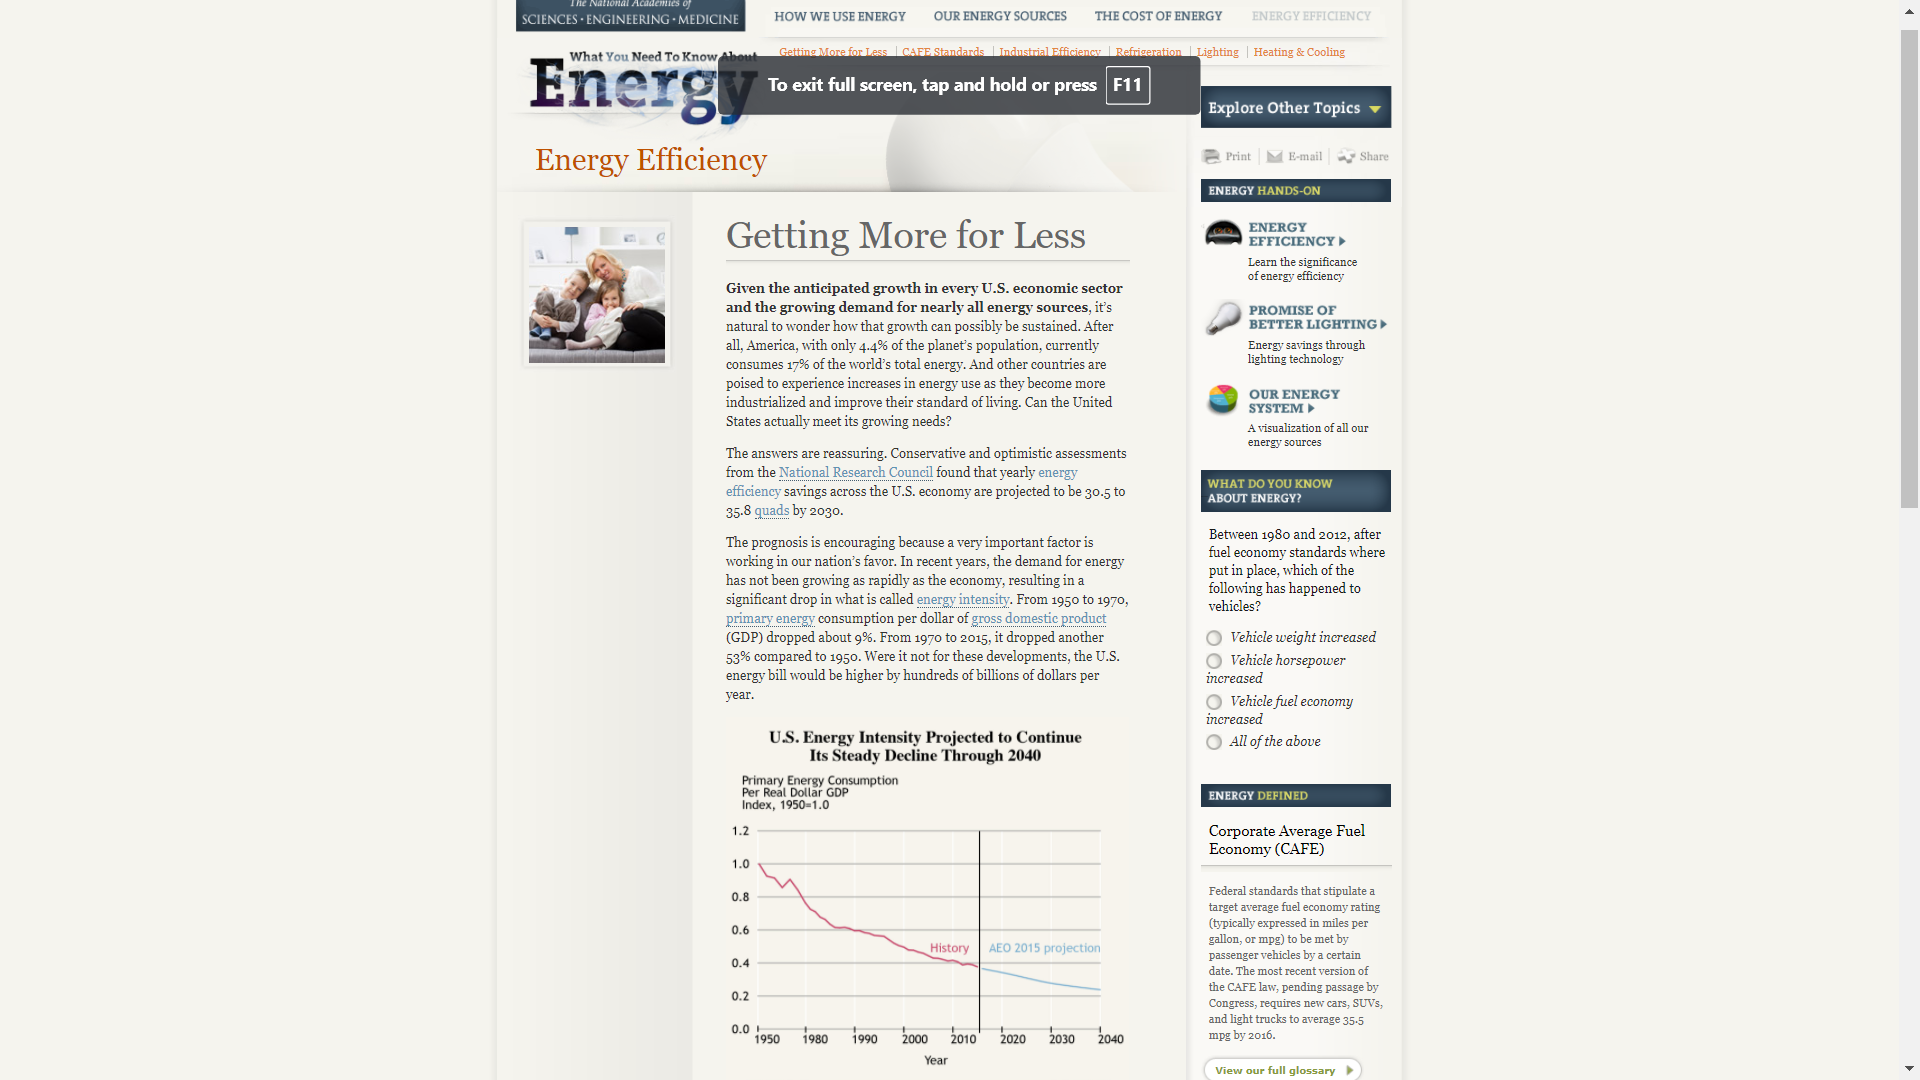
We hope the stable energy in future, but how to ensure and solve the problem. If increasing supply can make our headache, why we don’t think about reducing its demand by its efficiency? The authors of the website pointed out that “the demand for energy has not been growing as rapidly as the economy, resulting in significant drop in what is called energy intense“
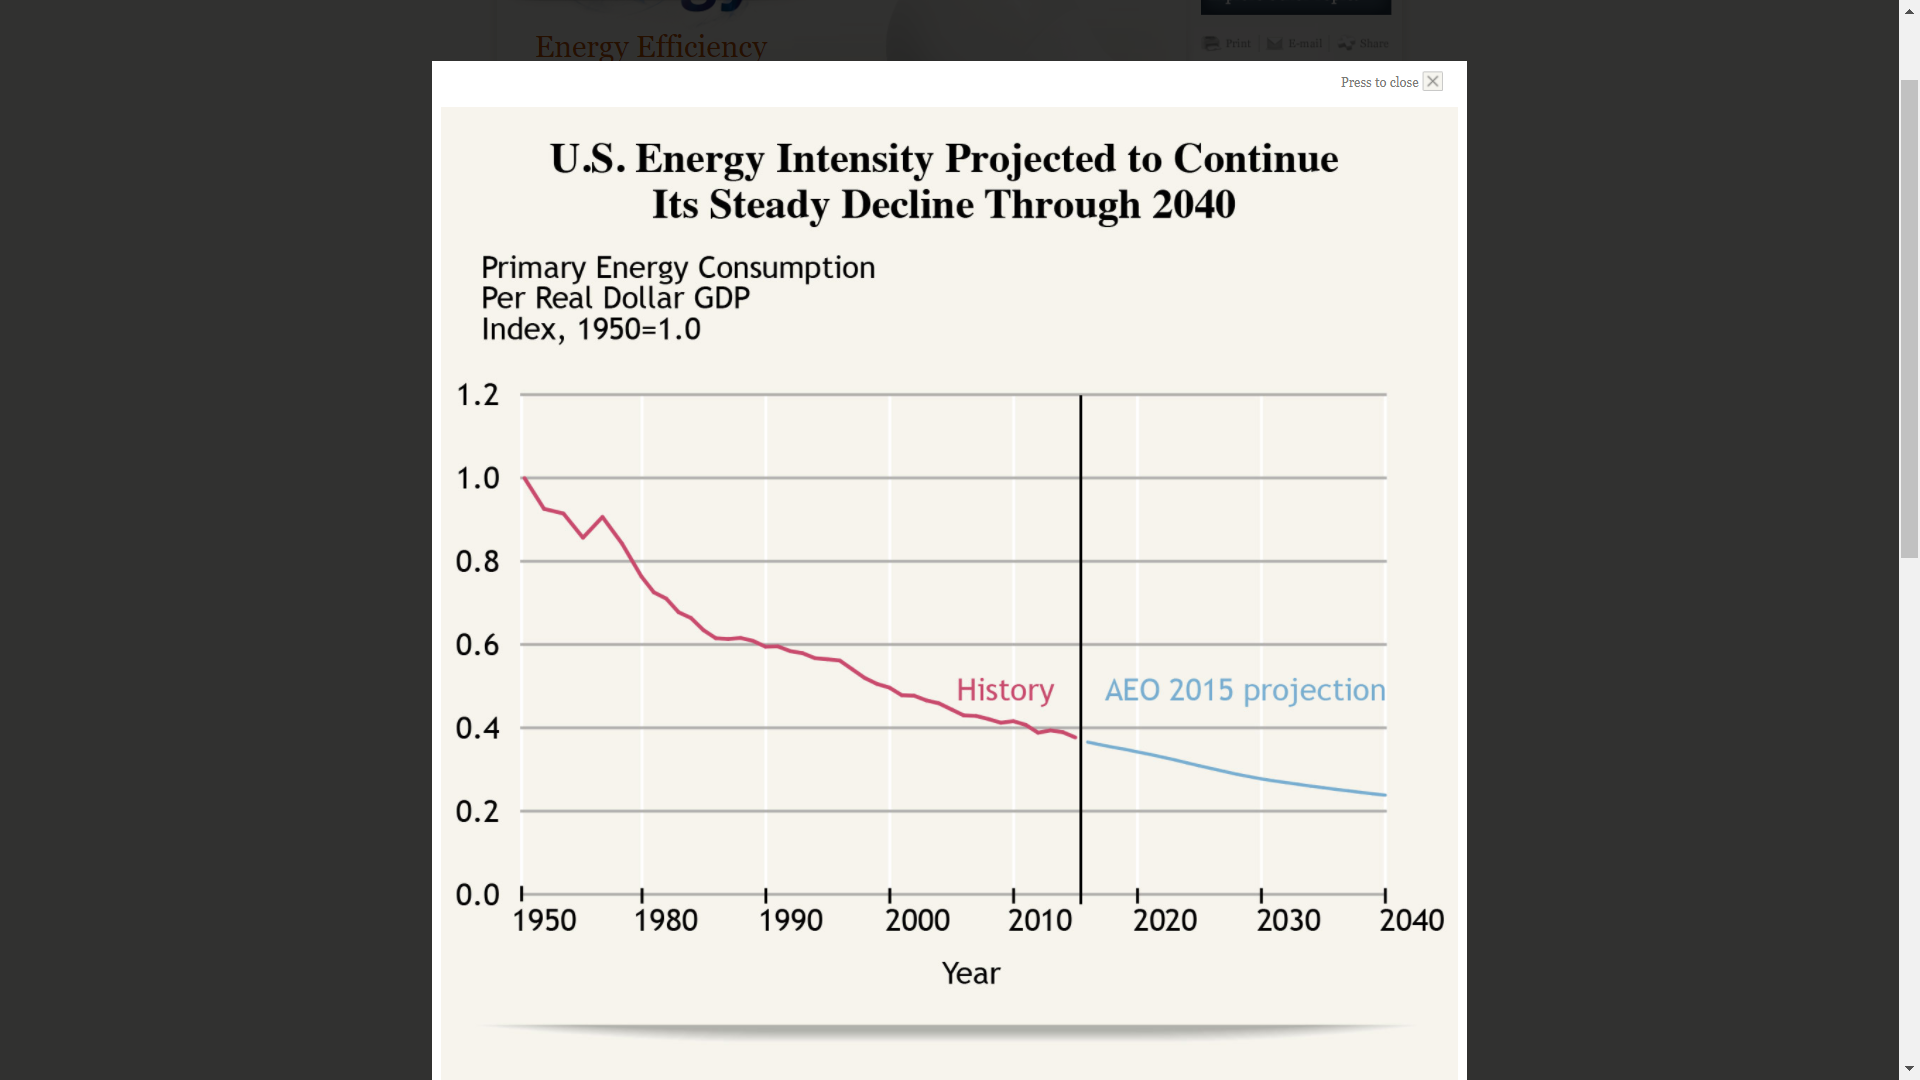
The above chart shows U.S. Energy Intensity Projected to continue its steady decline through 2040. The chart author used was the right chart for the right data to effectively communicate with us about an important consideration in our country.
Now, for the issue of energy in United States of America, the government expect the contribute from fields of technology, economic benefit, research, as well as government mandate and others.
Thank you. `
Reference
The National Academic of Sciences, Engineering, and Medicine. (2020). What You Need to Know about Energy . Retrieved from http://needtoknow.nas.edu/energy/