So with the semester starting to speed up it’s no surprise to literally anyone that I’m starting to fray around the edges a little bit. I don’t handle stress well, what can I say. Anyway, I thought this pie chart would be a good way for me to easily display how my time has to get broken up in order to live. See below.
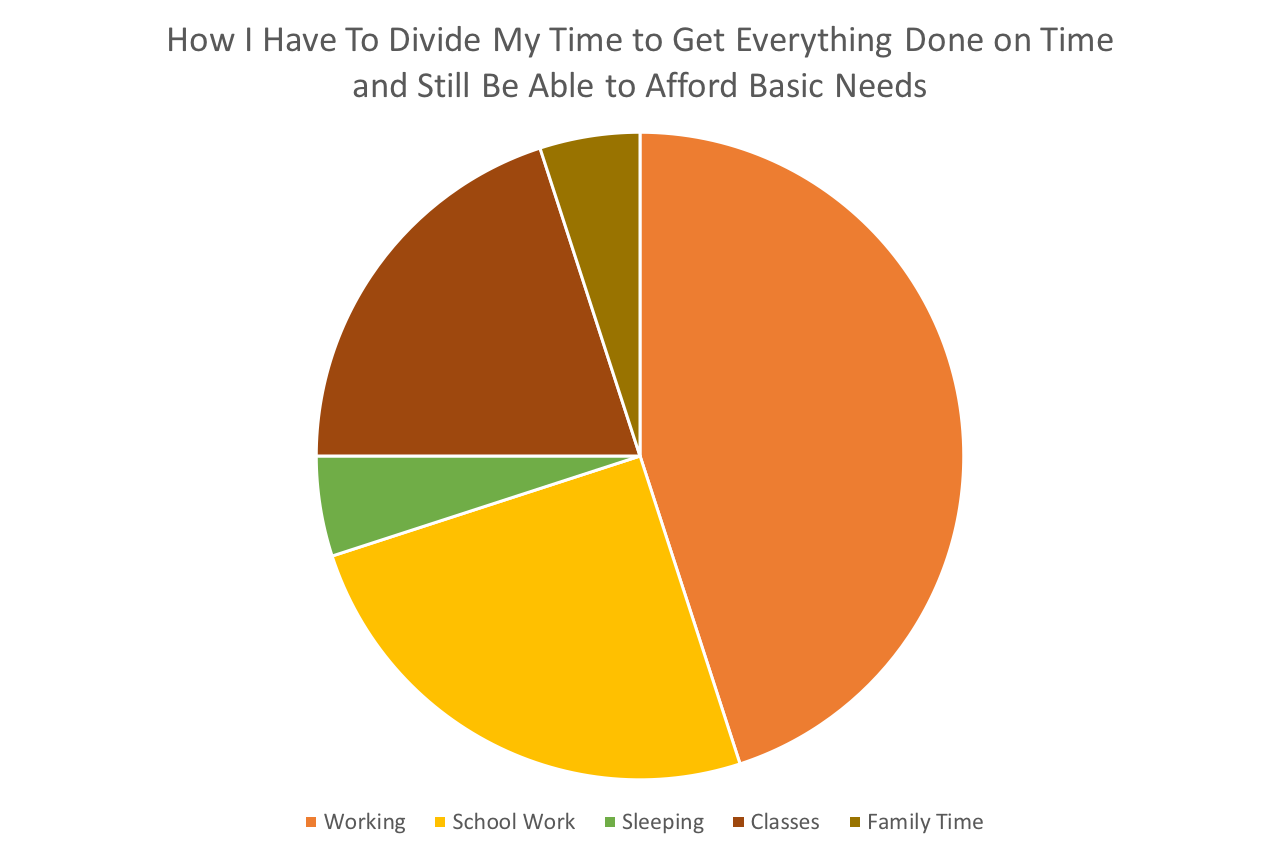
I think this is definitely the best way to display this data. I wanted to emphasize how much time work takes out of my life. I think it worked. I also think that it’s best to use a pie chart when trying to show a large difference between several things.