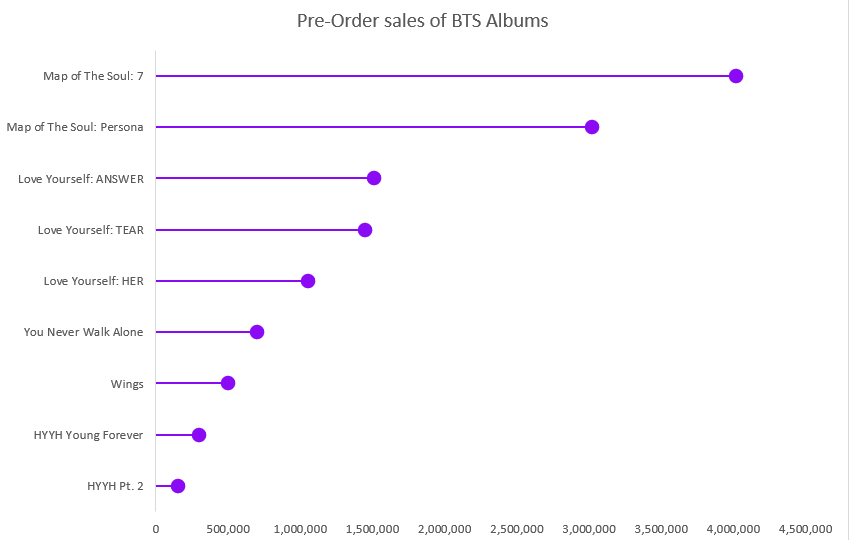
The Lollipop chart seemed like a lot of special formatting from the beginning and I was pretty much right. It is just a bar graph that you edit to make it look better. As always, I spent way to long looking for data, but stumbled upon BTS pre-order sale numbers while I was taking a break on Twitter. It took a lot of time and it probably isn’t a type of graph I would use often, but the style is easier on the eyes that a bar graph, especially if there are a lot of bars.

Like I said before, lollipop charts are best used when you have a lot of data to display, at least 20 different points, unlike my 9. It’s also saves on ink if someone would be printing this out to give to people or hand up. My biggest problem with this is that the circles aren’t an accurate representation of the number, the data point is located at the center of the dot and that makes it harder to read the true number. If you aren’t looking to be so precise with the visual and are looking to just show how the data points relate to each other, then using this graph is fine.
One reply on “Lollipop Chart”
I really liked the simplicity of your Lollipop chart. I agree that it was a lot of formatting for a simplistic style of presentation, but at least we can all have a general understanding of the information. A rule of thumb I use is that your presentations have to be simple enough for a fourth grader to understand, yet contain the information your readers need to see your point. Great Blog Post!