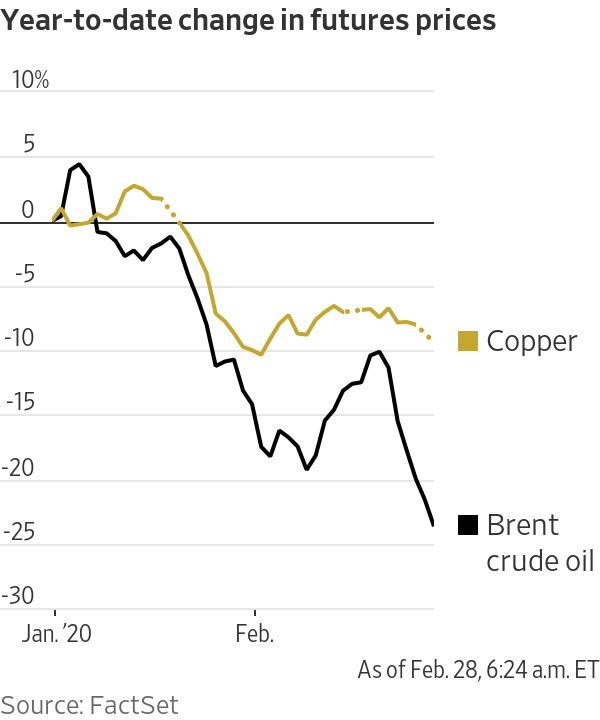
As you very well may know, bar graphs are great at displaying differences between groups when there is a comparison that needs to be made

https://www.varsitytutors.com/ged_math-help/bar-graphs
Bar graphs are an awesome tool….but they aren’t perfect
Bar graphs only tell you what your group performances were. But what if you had a specific goal or mark in mind? And that is where benchmark lines fall short, in their story telling ability.
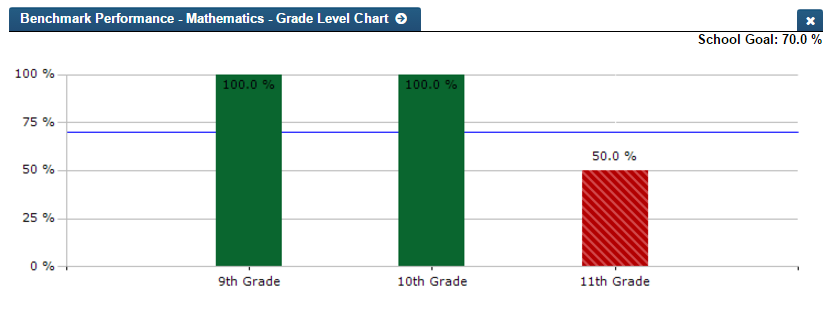
Some Of The Benefits Of Adding a Benchmark line
- Understand How Your Business Stacks Up Against Your Competitors
2. More effectively Track the Progress of Business Goals and Objectives
3. Set performance expectations