Adding a benchmark to your visualization can enhance the story to a reader. A visual target allows readers to easily determine whether or not a goal has been met. Benchmarks can be in the form of a line, indicator dots, overlapping bars or combo charts. Depending on the needs of your visual, the best way to display a benchmark will vary. Here are some examples of different visualizations using benchmarks.
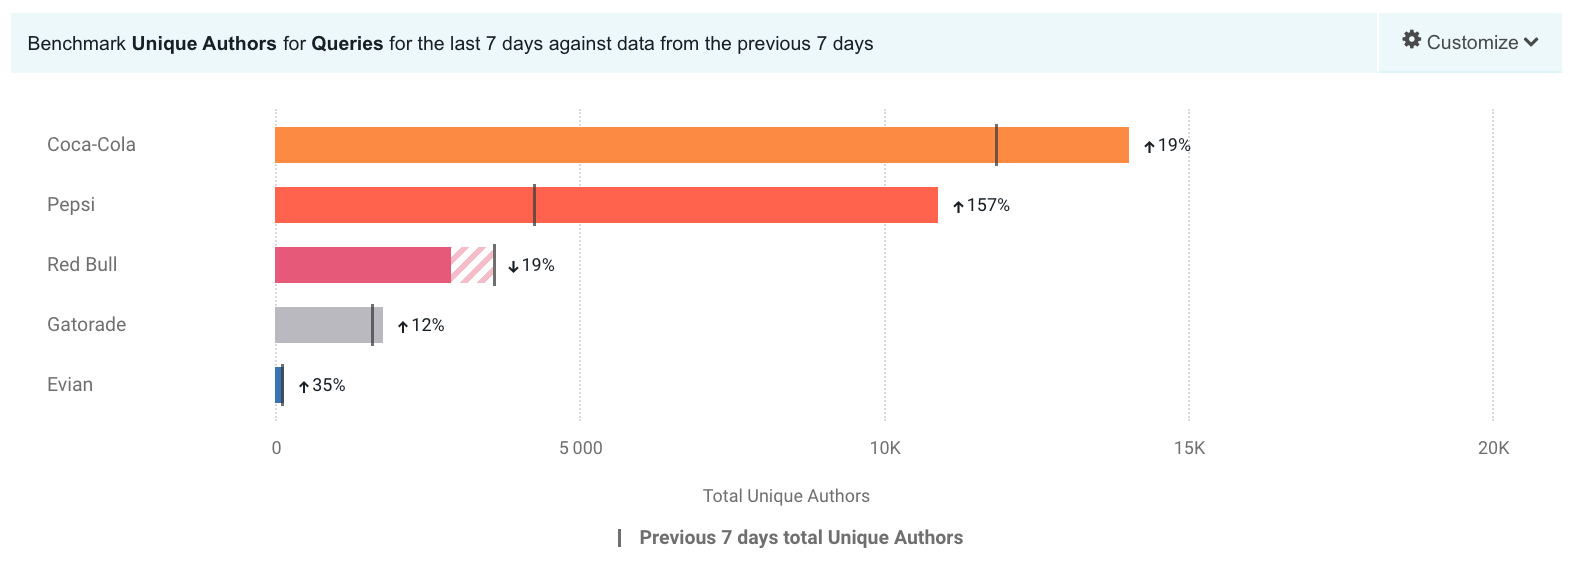
This take on a bullet graph uses a a benchmark line to compare how well different brands are doing relative to the brand’s previous performance. I think the use of a patterned filler to show that a company is not performing as well is unique. Especially for this data set, with only one company underperforming, this benchmark stands out.

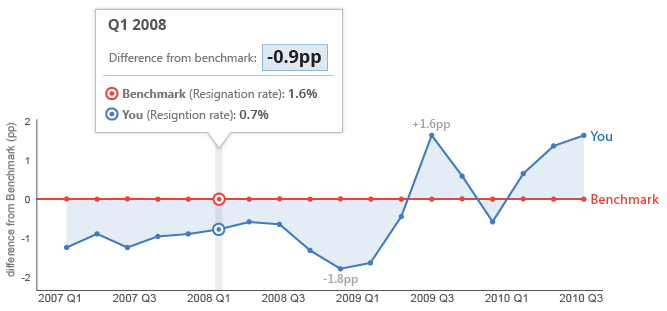
This graph features a line at 0 as the benchmark with another line showing how far off from the benchmark they are. With the benchmark at 0 you can easily see whether or not you are underperforming.

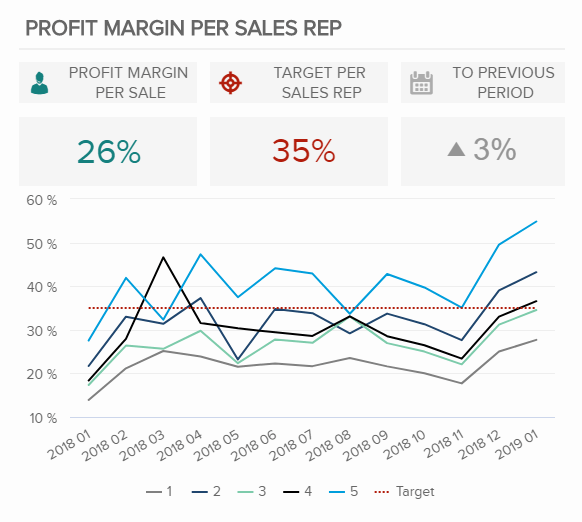
This graph displays the benchmark comparison as a simple dashed line.
