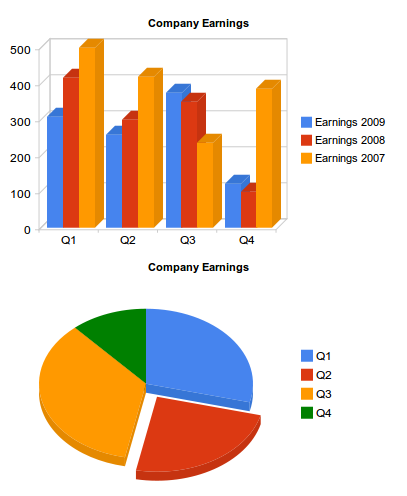
Google charts is a simple and easily navigated site. This site is free to all users. Google charts is specialized in chart infographics such as bar graphs, line graphs, and pie charts. Unlike piktohart there is not much room for creativity with very simple formats.
Piktohart is a complex platform with various different additives. In comparison to Google it is free to the public. To upgrade your use of the site upgrades and in website purchases are available. This website specializes in New and innovative infographics. This site gives you a second mind by giving inspiration of different ideas.
–It is acomputer-supported, representation of visual data to increase cognition.
– It isavisual presentation of data, information to be incorporated quickly & more clearly.
–Another name for Infographics is DataVisualization: present information clearer & effectively through graphic designs.
Did you know who were some of the First Persons To Use Infographics?!
–Early humans drew paintings on cave walls and rocks as a way of telling their story.
– The Ancient Egyptians told their stories of life, religion & work through the use of infographics.
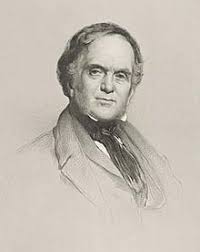
– In 1786, William Playfair used Infographic to create the Commercial & Political Atlas.
William Playfair designed line graphs & bar charts showing the economy of England
–1972-Otto (Otl) Aicher was the first to used Infographics to pictogram the Munich Olympics.
Otl Achie’s pictograms for the olympics are used today throughout society. 2 examples are the stick figure on cross walk signs, male & female stick figures on bathroom signs
– 1975-Edward Tuft is considered the father of Data Visualization.
Infographics are used by educators, researchers, students, and others looking to visually communicate with their audience. They are engaging visuals which come in many different shapes and sizes and are used daily in healthcare, classroom settings, etc. There are a number of guides and apps that can be used to effectively create the perfect infographic. Here’s a list of 5 great tools you can use today:
Canva Canva is a free graphic design and video app used by thousands to edit images and create infographics. With this app you can download infographics right from the app or you also have the ability to create them yourself. Canva also has over 60 million downloadable images as well as the ability to create team templates and hundreds of designs to choose from. Apple store rating: 4.9 stars
Piktochart Piktochart is a web based tool used to easily create infographics using ready to go templates. This is another free application and can be great for beginners who are just learning how to create infographics. Similar to Canva, you have the ability to collaborate with teams as well as integrate charts, photos, and icons.
Easel.ly Easel.ly is another web based application which comes with hundreds of free templates to create your own personalized infographic. With the ability to insert your own photos and artwork, the possibilities are endless. There is a huge range of charts, graphs, and images to choose from. Options such as timelines, reports, and even resumes are included in this free membership.
Cool Infographics: Effective Communication withData Visualization and Designby Randy Krum If you are looking for a book to read in your free time, this one by Randy Krum might be worth looking into. With a rating of 4 out of 5 stars on Amazon, Krum reviews the importance of infographics as well as beginner tips on how to create the most effective visualization. Ranging anywhere from $20-$35, this might be worth the purchase if you are looking to expand your knowledge on infographics. https://www.amazon.com/Cool-Infographics-Effective-Communication-Visualization/dp/1118582306
Video Guides- How to Make an Infographic in 5 Steps Video guides such as this one are free on Youtube and can be great for those who do not know where to start. This one by Venngage can be found on Youtube or on Venngage.com and is helpful for the audience in determining what should go into their infographic.
To Sum It Up..
Infographics are very useful in displaying data through a variety of different charts, graphs, images, and texts. They should be engaging and exciting and easily read. Thanks to technology and books, infographic templates, tips, and tricks are more accessible than every before. These tools listed above can help you whether you are a beginner and have little to no experience with creating infographics or even the advanced user who has plenty of experience.
In todays world of technology, the process of creating infographics can be done very easily. One site that is very useful is called www.canva.com. Canva is a graphic design platform that allows users to create social media graphics, presentations, posters, documents and other visual content. Users can choose from many professional designed templates, and edit the designs and upload their own photos through a drag and drop interface. Below is some of the many infographics that users have created on Canva. Their website also includes many free templates to use as a base for your infographic. Most importanly, Canva is free!