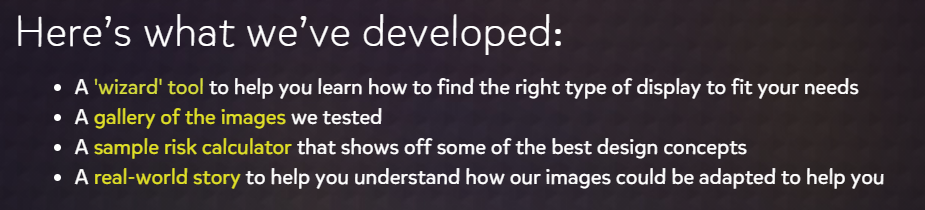
Visualizing health is a website that contains graphic displays of health information that they’ve validated through research among the general public. Visualizing Health was developed by the University of Michigan, with funding from the Robert Wood Johnson Foundation. This website states that data can help people make better decisions about their health. There is a “wizard tool,” a gallery of images, a sample risk calculator, and a real world story. This site contains 54 examples of tested visualizations. The goal of this site was to beautifully display health information.
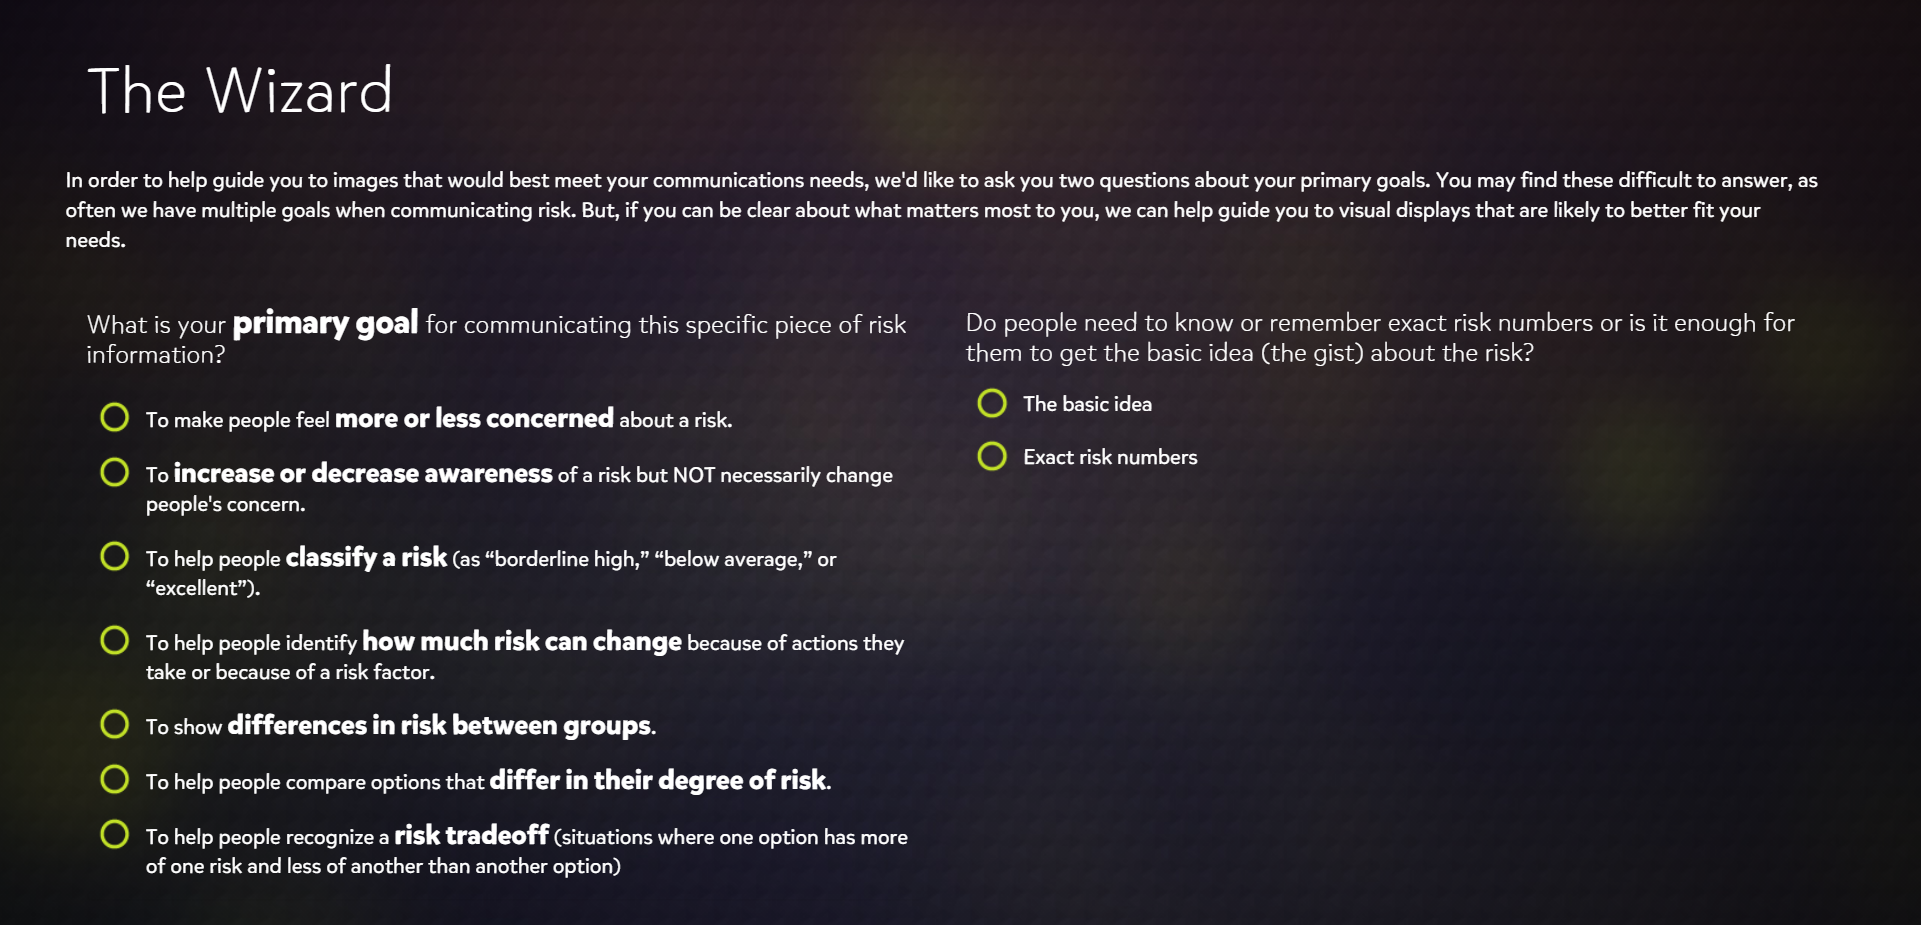
The Wizard Tool/ Gallery
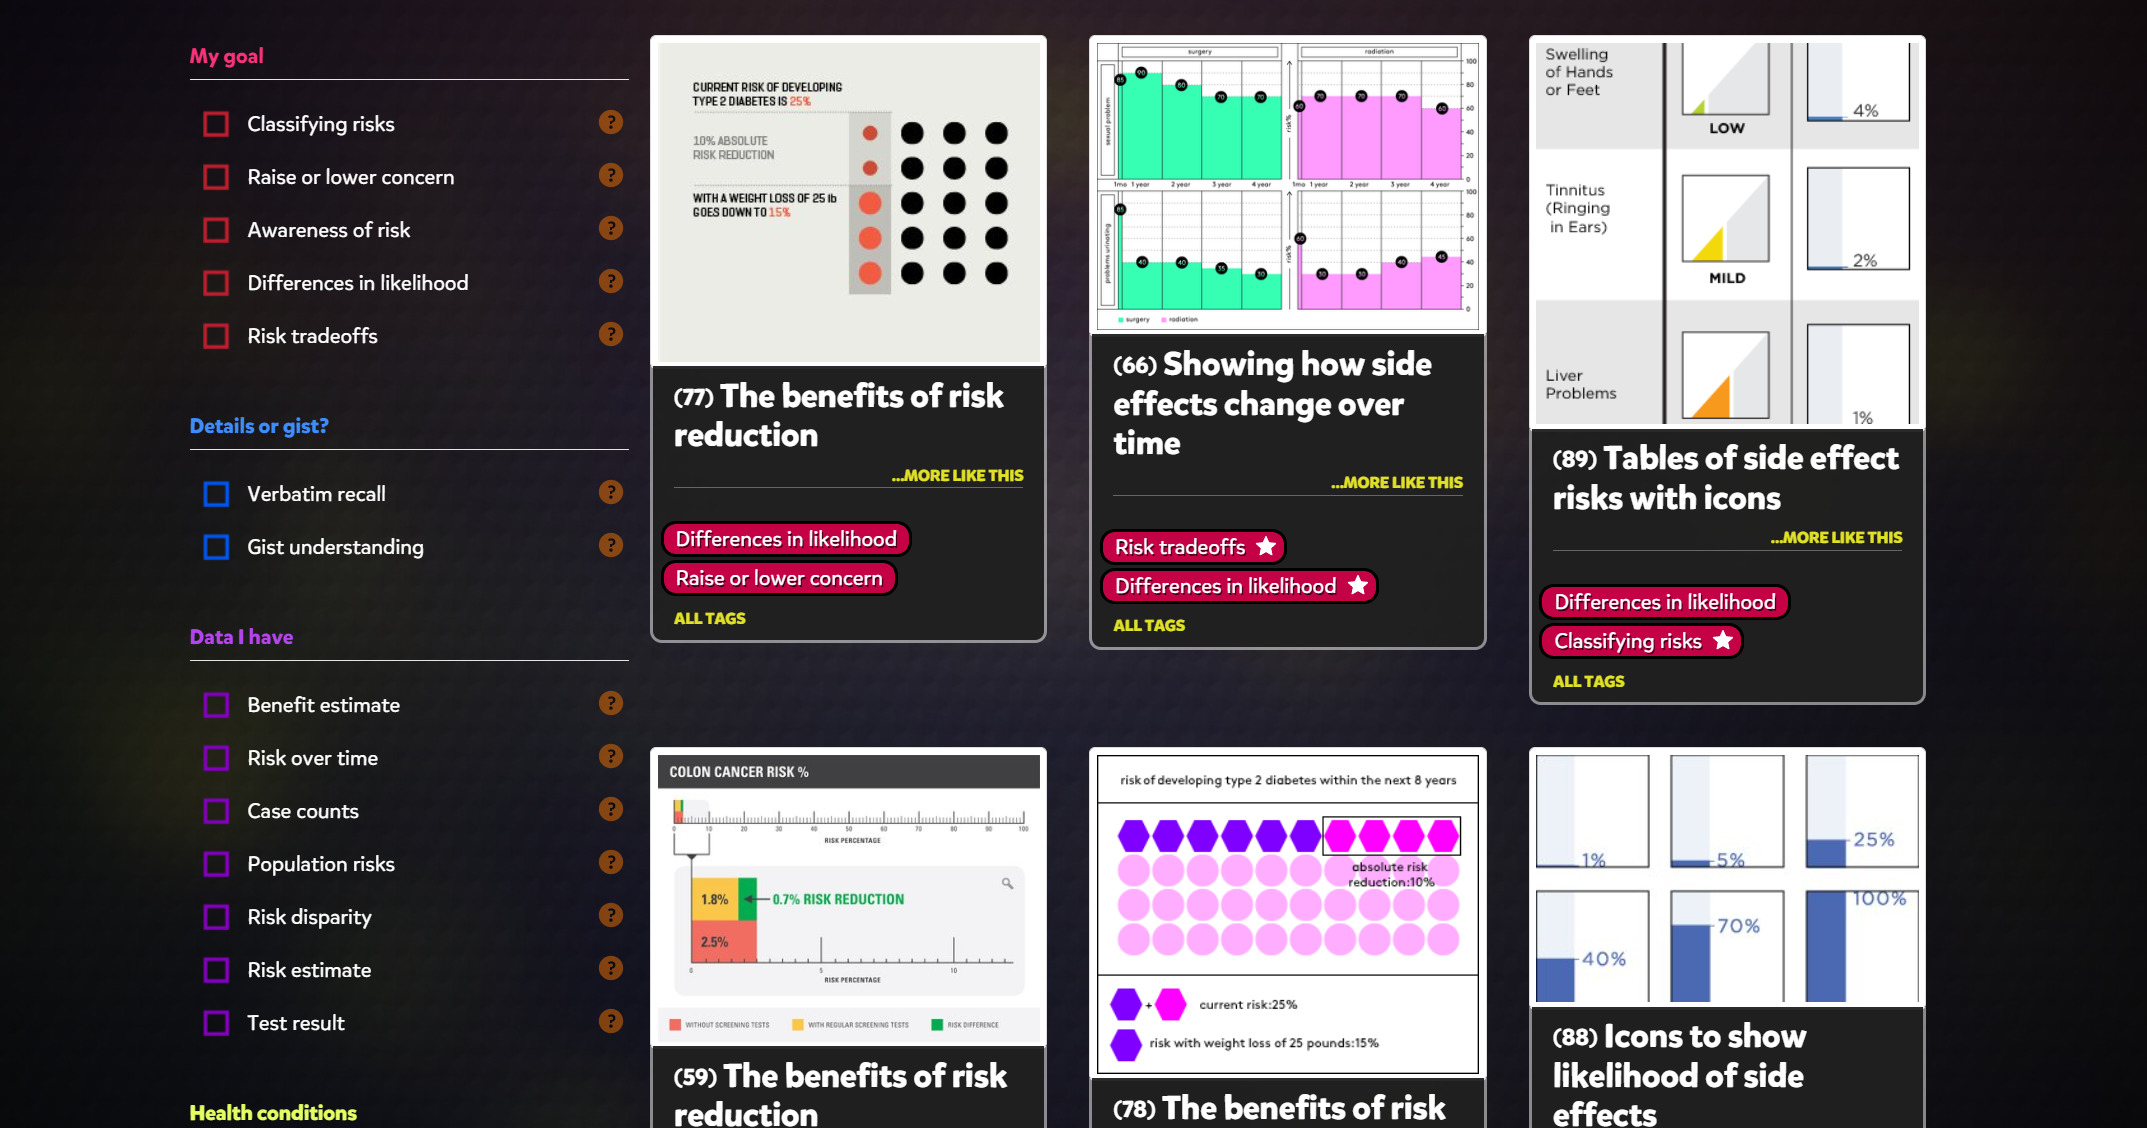
This tool is designed to help you learn how to find the right type of display to fit your needs. The wizard asks you to choose the information you would like to know more about. I selected my options and the wizard provided me with some data. The picture below is what The Wizard looks like. The second picture shows the data visualizations that came up, which is called “The Gallery”. There are many different options and ways that data is displayed. You are able to choose which way you would like the data presented to you. The wizard will show you the same data many different ways. This is very helpful.
Conclusion
Overall, I think that the Visualizing health website is very beneficial when learning about data visualization. There is a lot of information to view on this website. You can view data 54 different ways, which is extremely helpful.