There are several very popular and well done data visuals that I find attractive and useful and I thought I would share
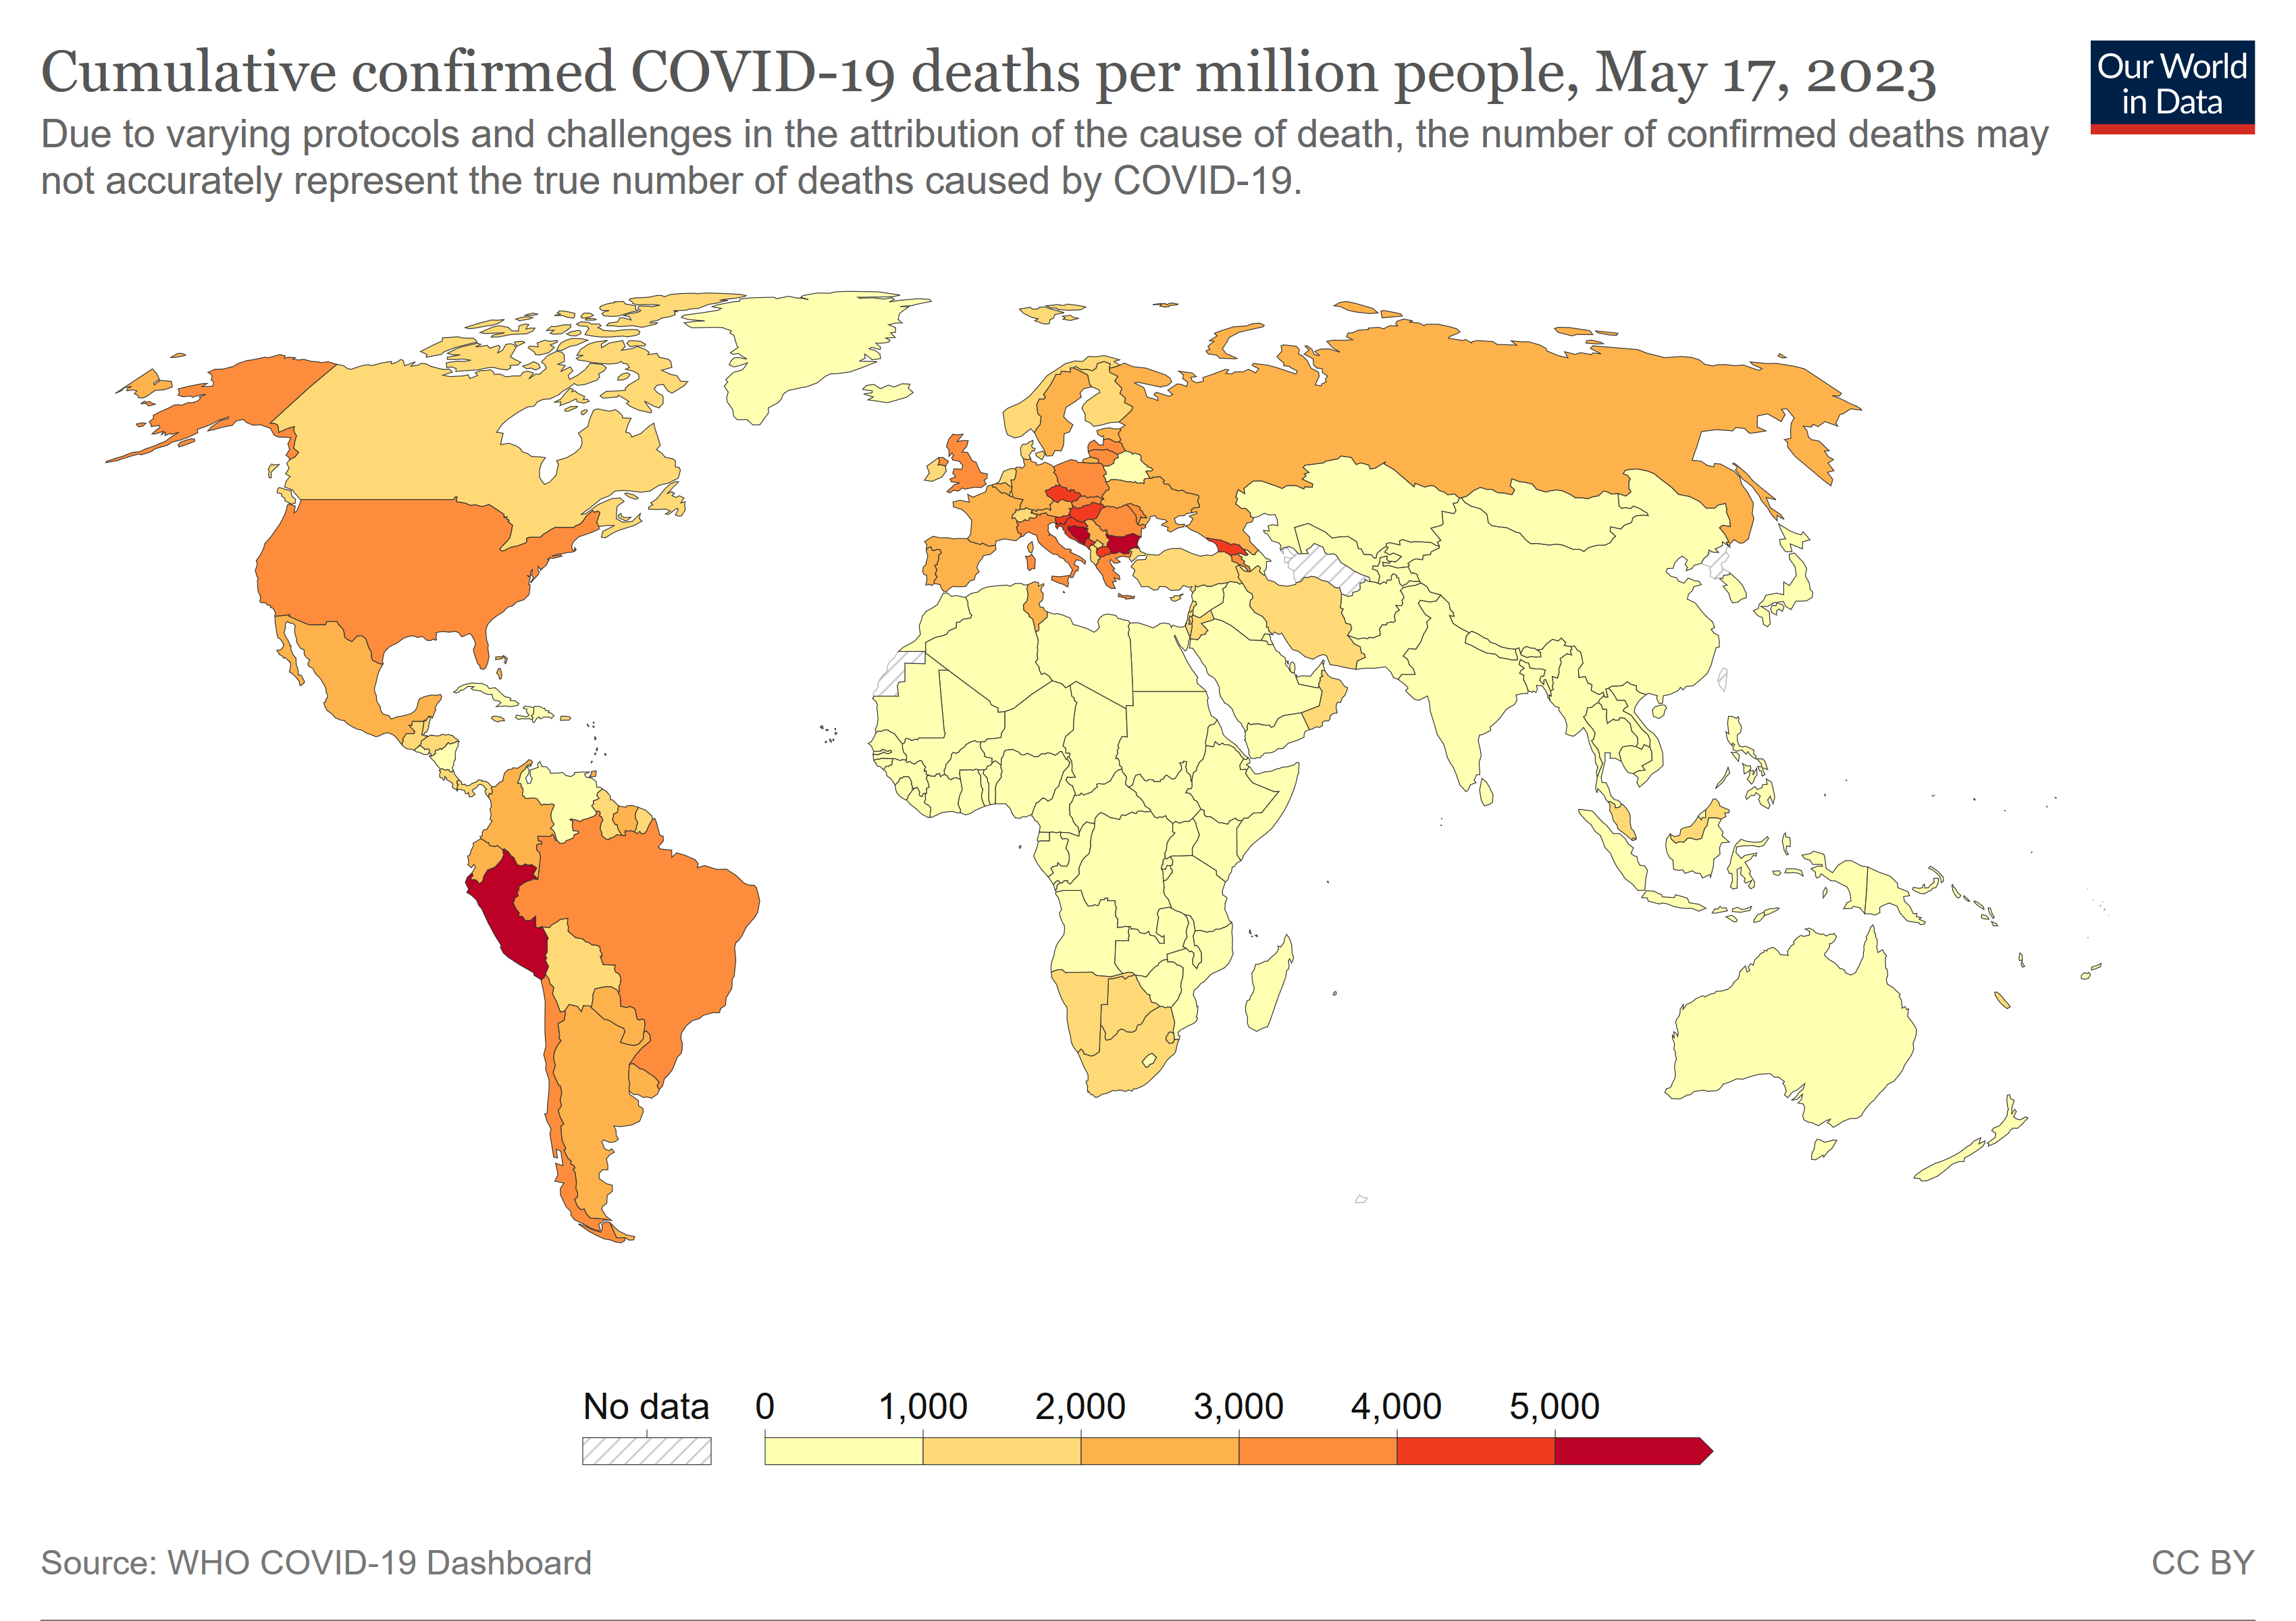
- Covid-19 Spread Data such as the one put together by the John Hopkins University. Probably my favourite data set put together in the last decade. The visuals change with data, it’s attractive, and it almost tells a ‘story’ of the Covid-19 and it’s behaviour around the world
2. Plastic Waste data Set. Made by National Geographic. It is kinetic, interactive , stimulating, and, even though some of it is not that pretty, they do that on purpose to show just how gross you should feel about waste.

3. Sydney Morning Herald’s sexual violence infographic.

this data set that was put together no doubt too much more research, and imagination, and time to put together. It is very interactive and tells a story with the data.
Source: https://en.rockcontent.com/blog/data-visualization-examples/