– It is a computer-supported, representation of visual data to increase cognition.
– It is a visual presentation of data, information to be incorporated quickly & more clearly.
–Another name for Infographics is DataVisualization: present information clearer & effectively through graphic designs.
Did you know who were some of the First Persons To Use Infographics?!
–Early humans drew paintings on cave walls and rocks as a way of telling their story.

– The Ancient Egyptians told their stories of life, religion & work through the use of infographics.

– In 1786, William Playfair used Infographic to create the Commercial & Political Atlas.

–1972-Otto (Otl) Aicher was the first to used Infographics to pictogram the Munich Olympics.

– 1975-Edward Tuft is considered the father of Data Visualization.

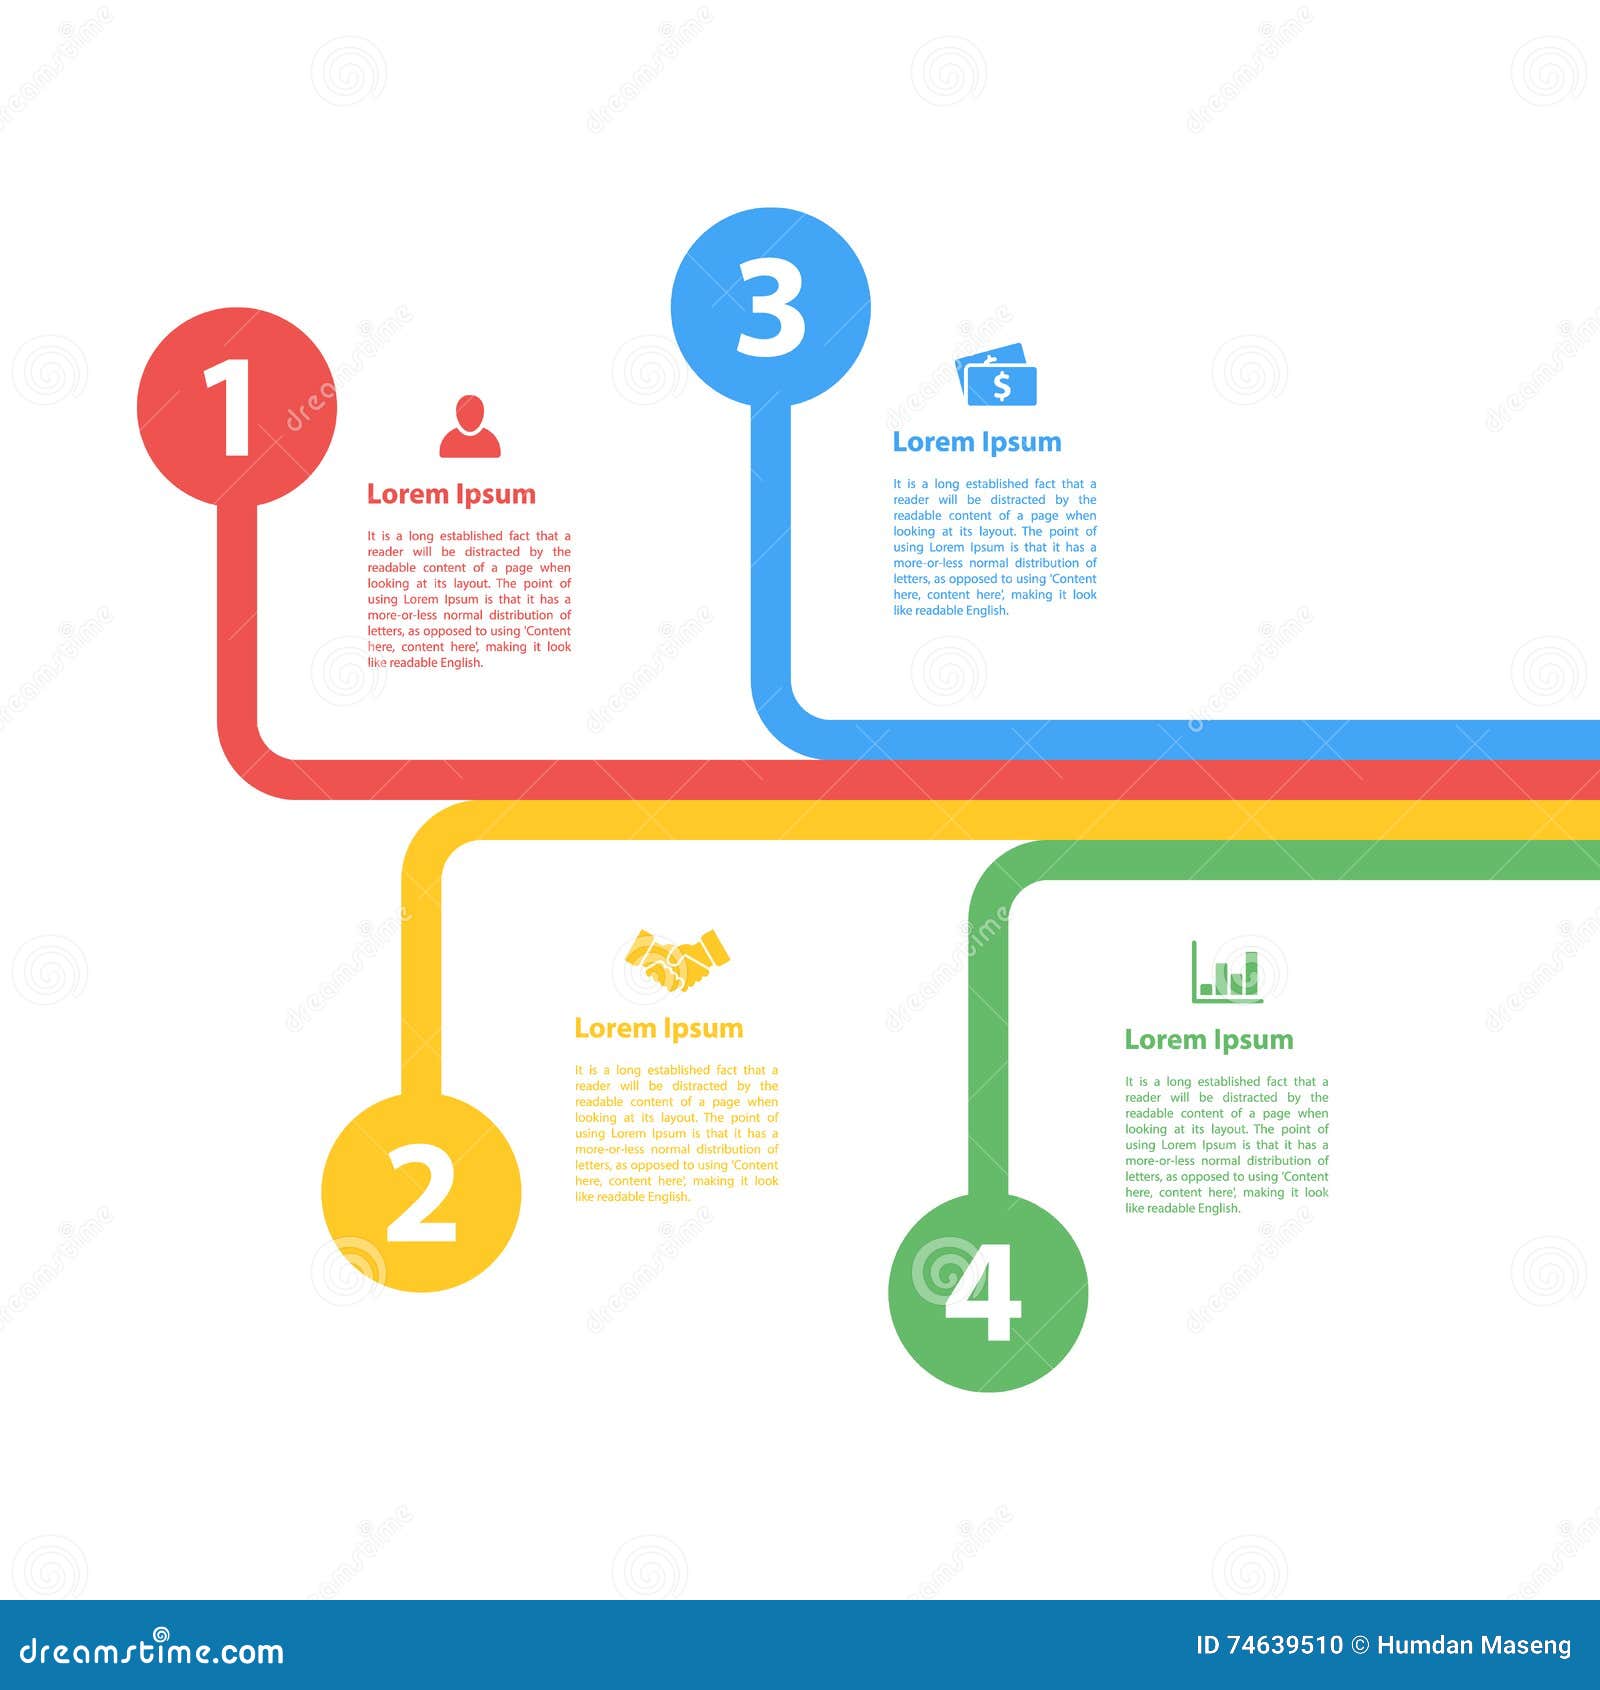
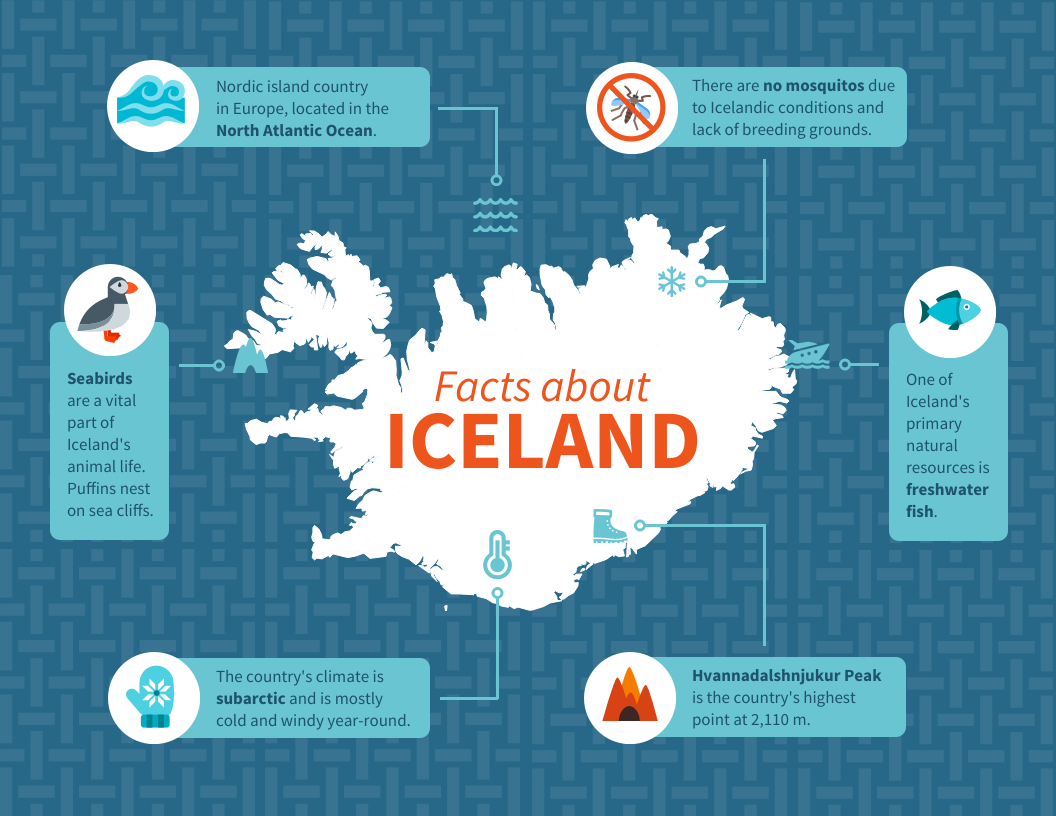
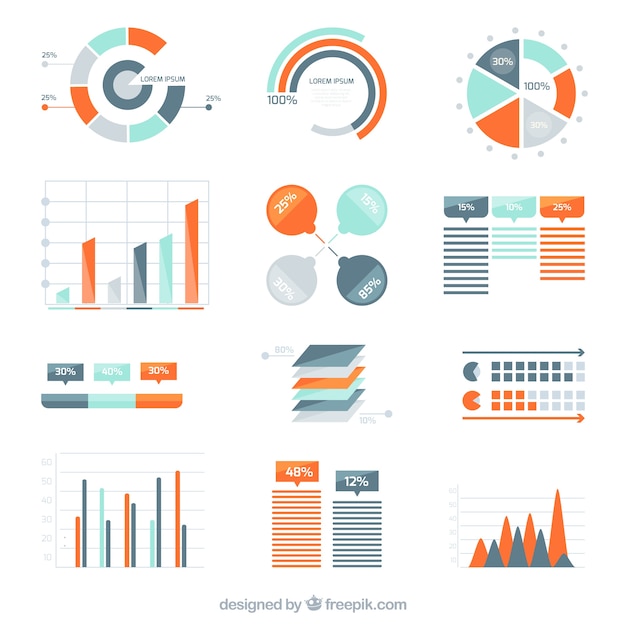
Types Of Infographics:

Fascinating ways to create infographics:
–IconArchive:www.iconarchive.com –Pixlr:www.pixlr.com Hohli:http://charts.hohli.com – Google Public Data
Six Awesome steps to creating a good infographic:
1.Consider the audience
2. Develop an idea
3. Sketch it out
4. Gather resources
5. Fact check resources
6. Sign it
Reference: https://visual.ly/m/history-of-infographics/#:~:text=Around%203000%20BC%2C%20ancient%20Egyptians,early%20innovator%20in%20Statistical%20Graphics.
One reply on “Infographics”
I really like how you incorporated the history and background of infographics in your post as well as using different fonts and colors (I have only been seeing black fonts so far). I find the chart generator you linked useful since it can be easily linked to your Google drive.